
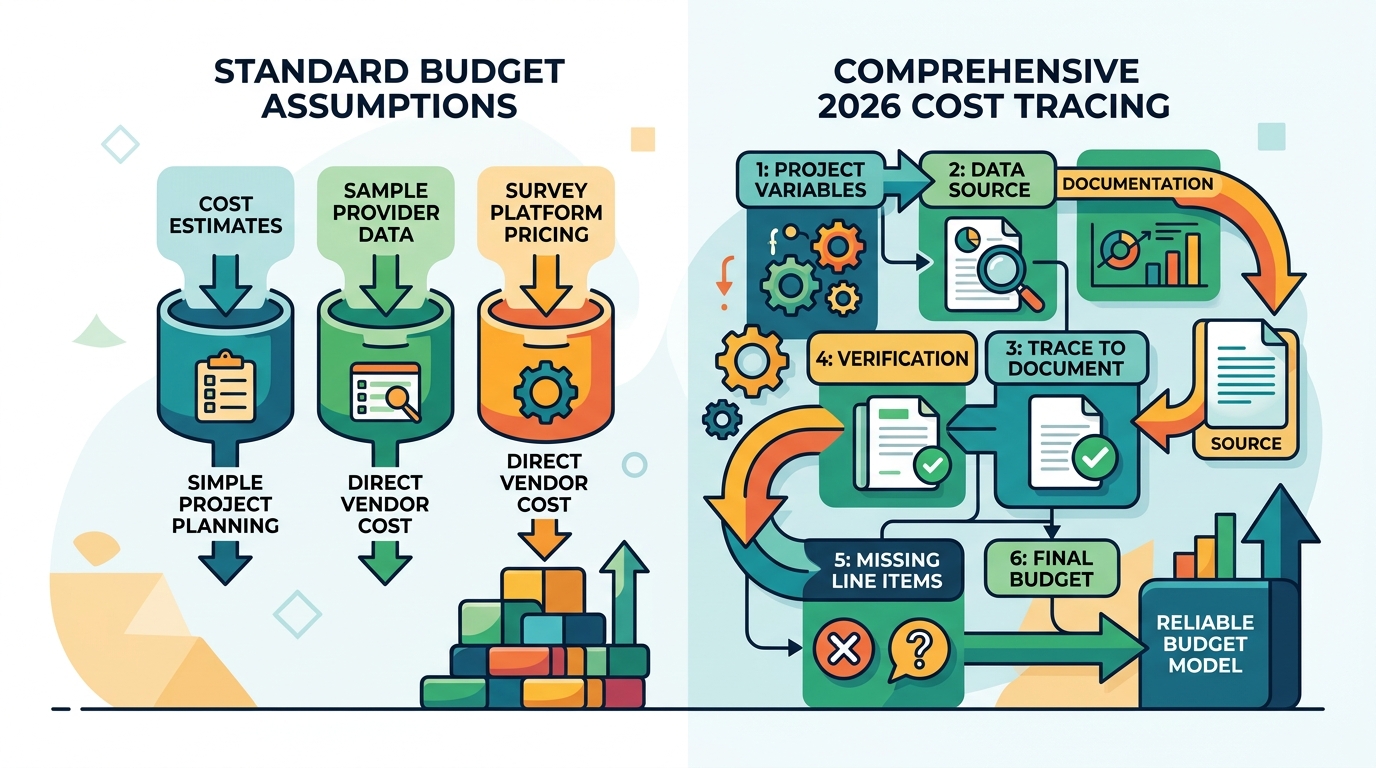
What a Survey Actually Costs in 2026, Traced to the Page Each Number Came From
Search for the cost of a survey and you will find "$2 to $15" and "$15 to $50" for the same study. Both are published. The disagreement is not noise — each figure answers a different question. Here is a sourced price list, plus the two cost lines nobody budgets for.
By Alex Li, Founder · Contact the author
Type "how much does a survey cost" and the answers you get are not just wide, they are contradictory. One vendor blog will tell you $2 to $15 per complete for the general population. Another will tell you $15 to $50 for the same thing. Both are published by companies that sell sample, and neither is lying.
The reason is that "cost per complete" is not one number. It is a function of at least five variables, and most published ranges quietly hold four of them fixed. Once you know which variable is moving, the ranges stop contradicting each other and start forming a curve you can actually budget against.
This is that curve, with every figure traced to the page it came from, plus the two lines that almost never make it into a budget and are the most likely reason a study fails to be usable.
The short version
- The cheapest published self-serve consumer sample in North America starts at $0.95–$1.00 per complete (Pollfish, SurveyMonkey Audience), for short, lightly-targeted, general-population surveys.
- A human participant platform with transparent maths puts a 10-minute study at roughly $1.90–$2.86 per complete — $8–12 per hour of participant time plus a 42.8% platform fee (Prolific's published numbers, applied by us).
- The widely-quoted $3–$8 band is the typical consumer band once you add screening, quotas, and a longer questionnaire. It is a compilation, not a quote, and this article says so explicitly rather than presenting it as a price.
- Above that, price tracks incidence rate far more than geography: deep-screened consumer work runs $8–$20, B2B professionals $20–$50, and low-incidence specialists $50+.
- The two lines missing from most budgets are the instrument (is the question fixed and published?) and verifiability (can a stranger re-add your columns?). They cost almost nothing and decide whether the number survives a fact-checker.
- For reference, our own platform's line items are published too: 500 completed respondents for $24.90–$49 depending on pack size, in 2 minutes 26 seconds — with the caveats that make that comparison honest rather than promotional.
Why the published numbers disagree
Four variables move the price of a completed response, and most public ranges are silent about three of them.
Questionnaire length (LOI). A four-minute survey and a twenty-minute survey are not the same purchase. Most quoted ranges are anchored to a 5–15 minute instrument, and everything above that drifts upward.
Incidence rate (IR). The share of the population that qualifies. A study of "US adults" has an incidence near 100%. A study of "US adults who bought a pickup truck in the last 90 days and tow with it monthly" might be 2%. Low incidence means paying for many screening attempts to obtain one complete, and it is the single largest driver of price above the consumer band.
Screening and quotas. Every additional qualifier and every interlocked quota (age × region × category use) makes the last few completes harder to fill. Quota cells fill with the same logic as airline seats: the last 5% of a cell is the expensive part.
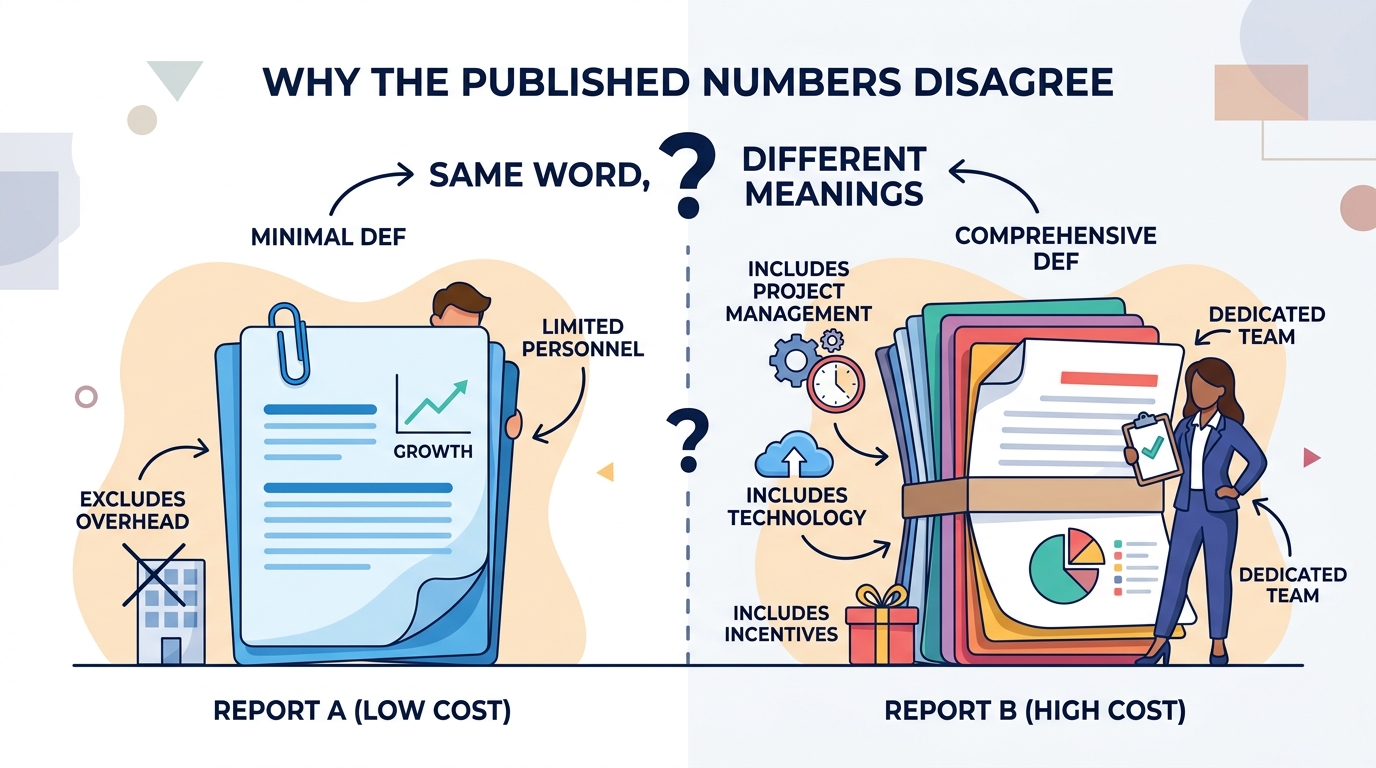
What is included. Participant incentive, platform fee, sample sourcing, and project management are often bundled differently. A $1 figure usually excludes management; a $40 figure often includes it. This is why the "$2–$15" and "$15–$50" published ranges coexist: one is quoting the sample, the other is quoting a project.
| Variable | What it does to price | Usually stated in published ranges? |
|---|---|---|
| Questionnaire length | Up, roughly linearly past ~10 minutes | Sometimes |
| Incidence rate | Up sharply below ~20% | Rarely |
| Screeners and quotas | Up, worst for interlocked cells | Rarely |
| Included services | Up 2–4× when managed | Almost never |
The price list, with sources
Two figures here we verified by opening the page and reading it. The rest are a compilation, and the difference matters, so it is marked in the table.
| Tier | What it is | Cost per complete | Where the number comes from |
|---|---|---|---|
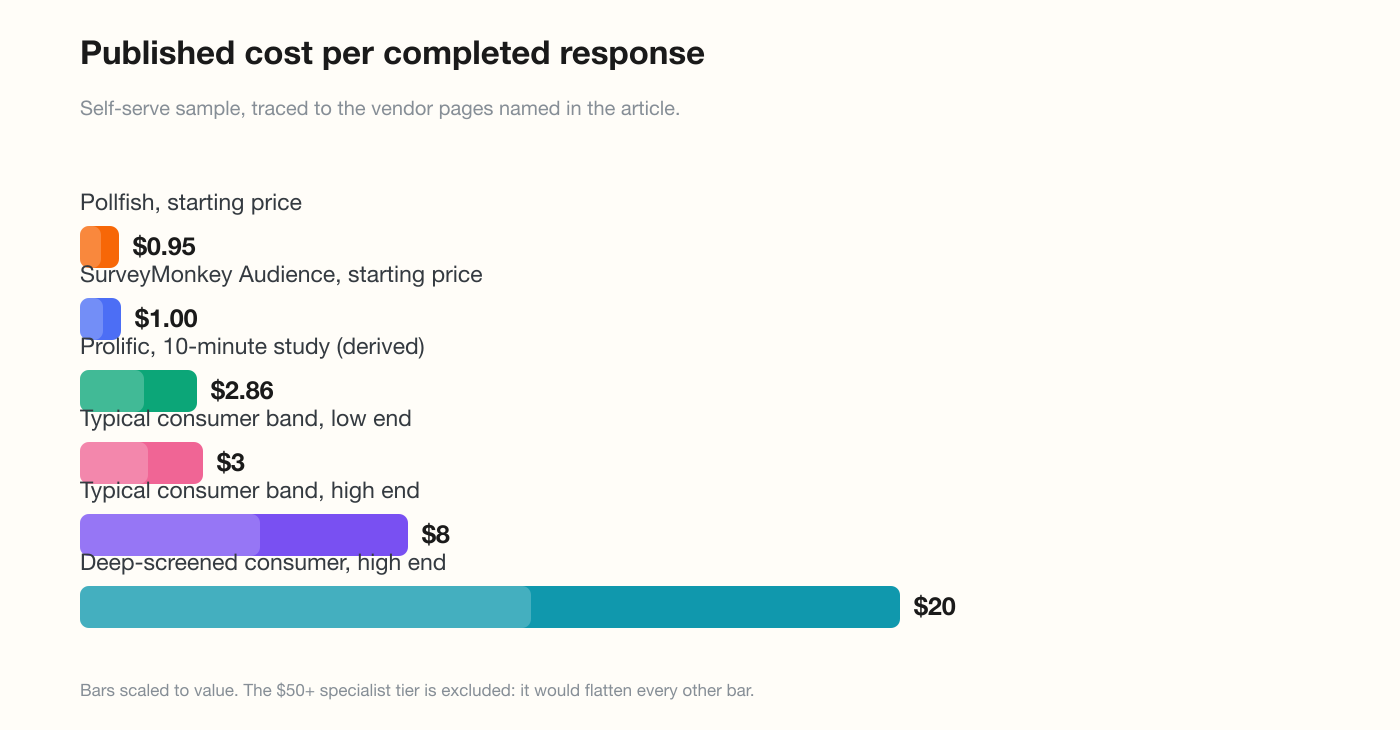
| Cheapest published self-serve | Short, general-population consumer survey | $0.95 | Pollfish pricing, "starting at $0.95" — their own calculator returns $95 for 100 responses |
| Cheapest published self-serve | Same, different vendor | $1.00 | SurveyMonkey Audience, "starting at $1 USD per response" |
| Human participants, self-serve | 10-minute survey on a participant platform | $1.90–$2.86 (derived) | Prolific's published rates: participants paid $8–12/hour minimum, plus a 42.8% platform fee for commercial customers. We applied the arithmetic; the inputs are theirs |
| Typical consumer quant | 5–15 minutes, light targeting, some quotas | $3–$8 | Compiled band, not one vendor's quote. This is the figure most commonly cited and least often sourced |
| Deep-screened consumer | Longer instrument, category users, interlocked quotas | $8–$20 | Compiled band |
| B2B professionals | Managers, buyers, developers, practitioners | $20–$50 | Compiled band |
| Low-incidence specialists | Rare occupations, executives, niche expert groups | $50+ | Compiled band |
Read the derived row carefully, because it is the most useful one. Prolific publishes two inputs a buyer can check — a minimum participant rate per hour and a platform fee — which means the floor cost of a human complete is arithmetic rather than a vendor's private pricing. At 10 minutes and the recommended $12/hour it is $2.00 of participant pay, $0.86 of fee, $2.86 total. At the $8/hour minimum it is $1.90. Everything above that is either a longer questionnaire, a harder filter, or someone else's margin.
That also explains the most-quoted band in the industry. $3–$8 is what happens to a $2 participant payment once you add screening, quotas, and a realistic completion rate. It is not a conspiracy; it is the same $2 with more conditions attached.
What 500 completes actually costs at each tier
Sample size turns the per-complete rate into a budget. 500 is a common starting point because it is roughly where a study can resolve a difference of about 9–10 points — see the companion piece on sample size for why that sentence needs a second clause.
| Tier | Rate per complete | 500 completes |
|---|---|---|
| Cheapest published self-serve | $0.95–$1.00 | $475–$500 |
| Human participants, 10-minute, self-serve | $1.90–$2.86 | $950–$1,430 |
| Typical consumer quant | $3–$8 | $1,500–$4,000 |
| Deep-screened consumer | $8–$20 | $4,000–$10,000 |
| B2B professionals | $20–$50 | $10,000–$25,000 |
| Low-incidence specialists | $50+ | $25,000+ |
If your project sits in the last two rows, the cost conversation changes character. At $20,000 for a study, the binding constraint stops being the sample and becomes the decision: a project at that price should be answering a question you will act on for a year, not one you will re-ask next month.
The two lines nobody budgets for
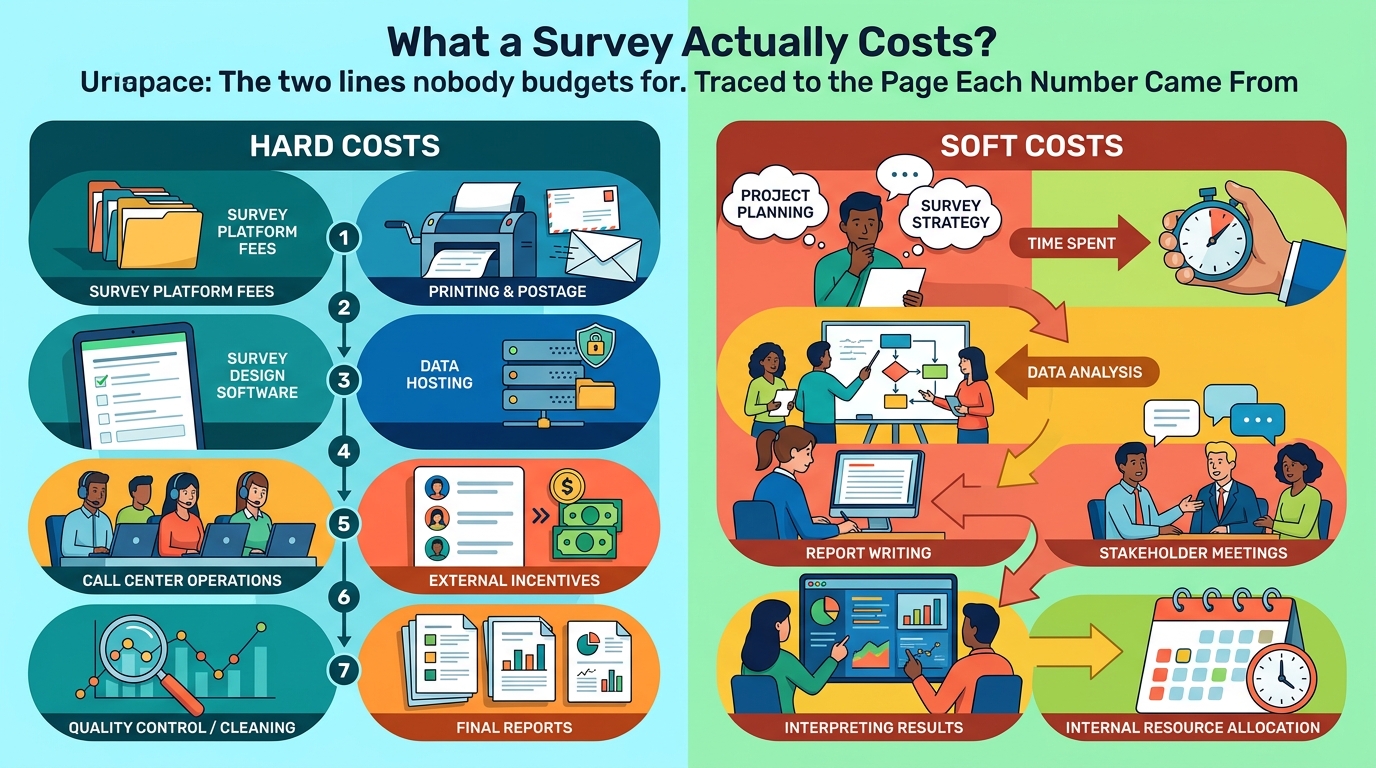
The per-complete price is the visible part of a research budget, and it is not where studies fail.
One: the instrument. Who writes the questionnaire, and is it fixed? A study whose instrument is regenerated between waves cannot be trended, because the second wave is a different question. We measured the size of that effect on our own platform and it was larger than the sample-size effect: the same two options, at the same sample size, produced leads of +21, +22, +6 and −13.6 points across four runs, with the leader changing hands. If you are paying a panel for a benchmark you intend to repeat quarterly, budgeting for a fixed instrument — and asking a vendor to confirm they reuse one — is worth more than adding 500 more respondents. (The full experiment.)
Two: verifiability. A number is only citable if a stranger can check it, which means publishing the instrument, the population definition, the fielding date, and ideally the per-respondent rows. This costs a page and a decision, not money. It is also the line item most likely to be omitted, and the reason an expensive study can end up unusable in a pitch while a cheap one survives. (We itemized this end to end.)
Neither of those is a reason to spend less on sample. They are reasons not to spend only on sample.
Where the cheap end stops being comparable
A price list like the one above invites a conclusion it does not support, so here is the boundary stated plainly.
A $0.95 complete and a $24.90 synthetic complete are not the same product at different prices. The panel version pays a person to answer, and that person brings real behaviour, real misreporting, and real refusal. The synthetic version generates answers from US Census Bureau ACS PUMS records — 100,000 of them, carrying demographic attributes and behavioural trait labels — and what it buys you is speed, an inspectable pool, and respondent-level rows you can cut by segment.
Those are different goods with different failure modes, and the failure modes are measured rather than asserted. When we benchmarked our own sample against published national figures, gender and region landed within a point but two strata were severely under-represented, and we published the records that show it (the frame audit). A budget comparison that stops at the per-complete rate hides exactly the thing a buyer needs.
How to budget a study in fifteen minutes
- Write the decision first, in one sentence. If you cannot, no sample size will save the study.
- Estimate incidence. What share of the adult population qualifies for your question? Under 20% is where budgets go wrong.
- Set the questionnaire length. Count the minutes honestly, including screening.
- Look up your tier above, then multiply by your sample size. Add 15–25% for quota overage, which is the normal cost of filling the last cells of a quota grid.
- Decide whether you need a fixed instrument. If the study will be repeated, this is a requirement, not a preference, and it may rule out some vendors entirely.
- Budget the disclosure. Public instrument, population string, fielding date, per-respondent rows. It costs a page.
- Only then compare methods. Human panel, synthetic sample, or a published secondary source. For a question whose answer is already published, the correct budget may be zero.
Limitations
This is a price compilation, not a quote. The two self-serve floor prices and Prolific's rate structure were verified by reading the vendors' pages; the higher bands are ranges we compiled and are labelled as such, and vendor pages change without notice. Nothing here reflects agency-managed projects, which typically cost more than sample alone, nor translation, weighting, or analysis. The derived $1.90–$2.86 figure applies Prolific's published fee to their published minimum rates for a 10-minute instrument; a real project's cost depends on the reward you set and the actual completion time. Finally, the synthetic comparison carries every caveat in the companion studies — cheaper is not the same as equivalent, and where the pool is thin, no price makes the sample usable.
Frequently asked questions
Why can't I get one straight number? Because "per complete" hides four variables. Ask any vendor for their rate at a stated length, a stated incidence, and a stated quota structure, and the numbers converge quickly.
Is $1 per response real? Yes, for what it buys: a short, lightly-targeted consumer survey with little screening. It is real sample and it is genuinely cheap. It is also the tier where quota cells are hardest to fill, so budget overage.
Do I need 500 completes? 500 resolves roughly a 9–10 point difference at 95% confidence in the textbook model. Whether that is enough depends on the size of the effect you are trying to detect — and on whether the number is stable across runs at all, which is a separate question with its own answer.
What is the cheapest way to get a citable number? Often not a new study. If a published source already answers your question, cite it — that is free and more credible than a small original study. Commission research when the question is novel, which is also the only case where a synthetic sample has no recall-based competitor.
Where does the money actually go on a panel study? Mostly to participant incentives and to the cost of finding qualified people. Platform fees are the visible part; incidence is the invisible part.
Disclosure
MoeVox is our product, and we sell credits, so the comparison above is not disinterested. The vendor prices were chosen for being published and checkable, not for making our line look better; the two lowest figures in the table are competitors' prices, and they are lower than ours per complete at the very cheapest tier. Our own line items — 500 credits, $24.90–$49, 145.7 seconds — are published with the run that produced them, and the caveats about where the method is not comparable are in the companion studies rather than buried here.
Sources
- Pollfish pricing page — https://www.pollfish.com/pricing/
- SurveyMonkey Audience product page — https://www.surveymonkey.com/product/features/audience-panel/
- Prolific pricing page (participant rates, platform fee) — https://www.prolific.com/pricing
- U.S. Census Bureau, ACS PUMS 2024 — the demographic source the synthetic respondent pool is built from
- Our own ledger for one 500-respondent study, itemized: research-data/chatgptgrow-ledger.json