
How Many Survey Respondents Do You Need? The Textbook Answer Is Right and It Is Not Enough
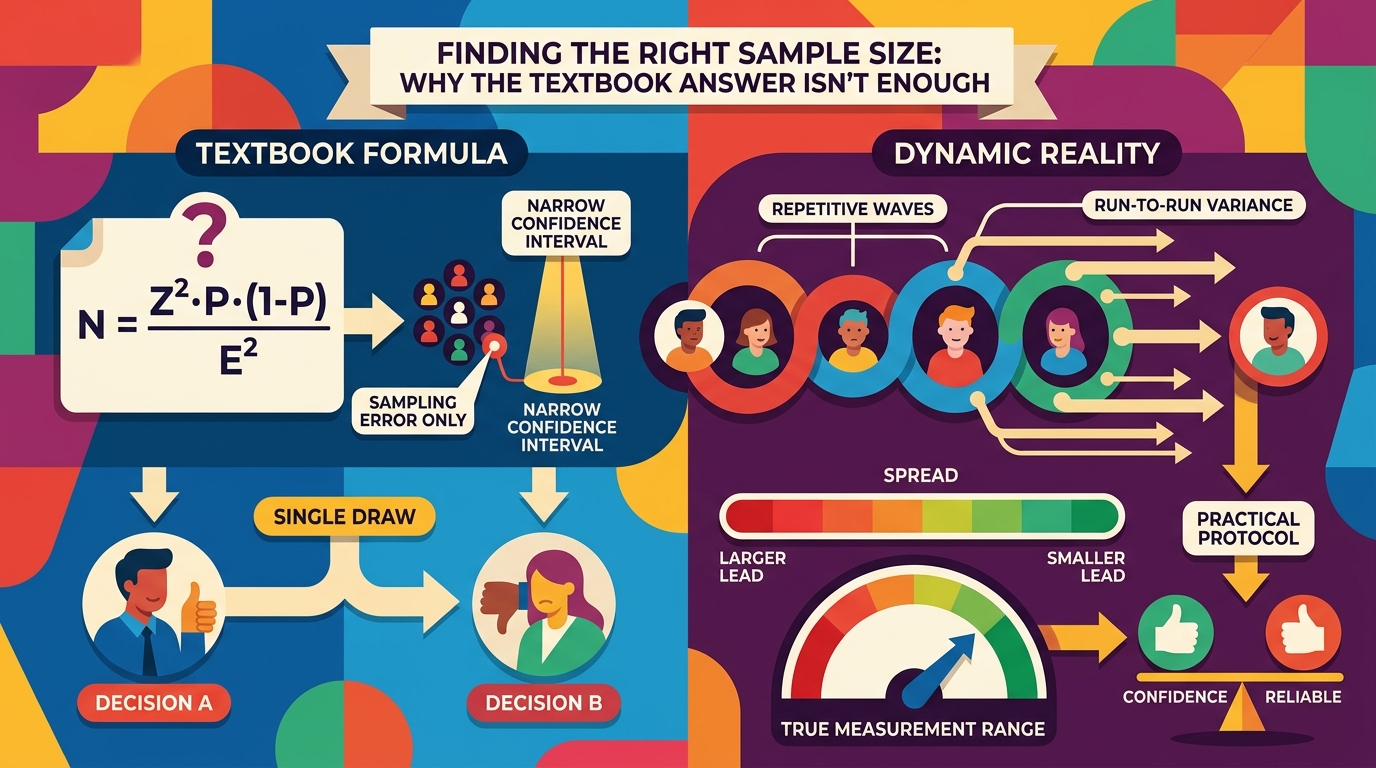
Every sample-size calculator gives you the same number for a 5% margin of error, and every one of them assumes your question means the same thing each time you ask it. We ran the same question at five sample sizes. The interval narrowed. The answer did not settle.
By Alex Li, Founder · Contact the author
The textbook answer is easy to find and it is correct. For a 95% confidence level and a 5% margin of error, with maximum variance assumed, you need 385 completed responses — and that number is almost independent of population size, which surprises people the first time they see it.
The part that is missing from every calculator is an assumption sitting underneath the formula: that the question you are asking in wave two is the same question you asked in wave one. We tested that assumption on our own platform by holding the question fixed and varying only the sample size. The interval narrowed exactly as the textbook predicts. The answer moved 9.4 points anyway.
The short version
- The standard formula gives 385 completes for ±5%, 1,068 for ±3%, and 2,401 for ±2%, all at 95% confidence.
- Those numbers are about the precision of one draw from a fixed instrument. They say nothing about whether the instrument is fixed.
- We ran the same two-option question at n=50, 100, 200, 500 and 1,000. The leading option's share came back 54.0%, 52.0%, 58.5%, 49.6%, 49.1% — the lead shrank from 21 points at n=200 to 3.5 points at n=1,000, and the two intervals do not overlap.
- Non-overlapping intervals mean the movement is not sampling error. Something outside the formula is moving the number between runs.
- Buying more sample buys a narrower interval around a moving target. If your decision depends on a small lead, repetition buys you more than sample.
- The practical protocol: run it twice before believing a small lead, report the spread alongside the interval, and never compare two runs unless the fielded question was identical.
The formula, and the assumption inside it
The standard sample-size formula for a proportion is:
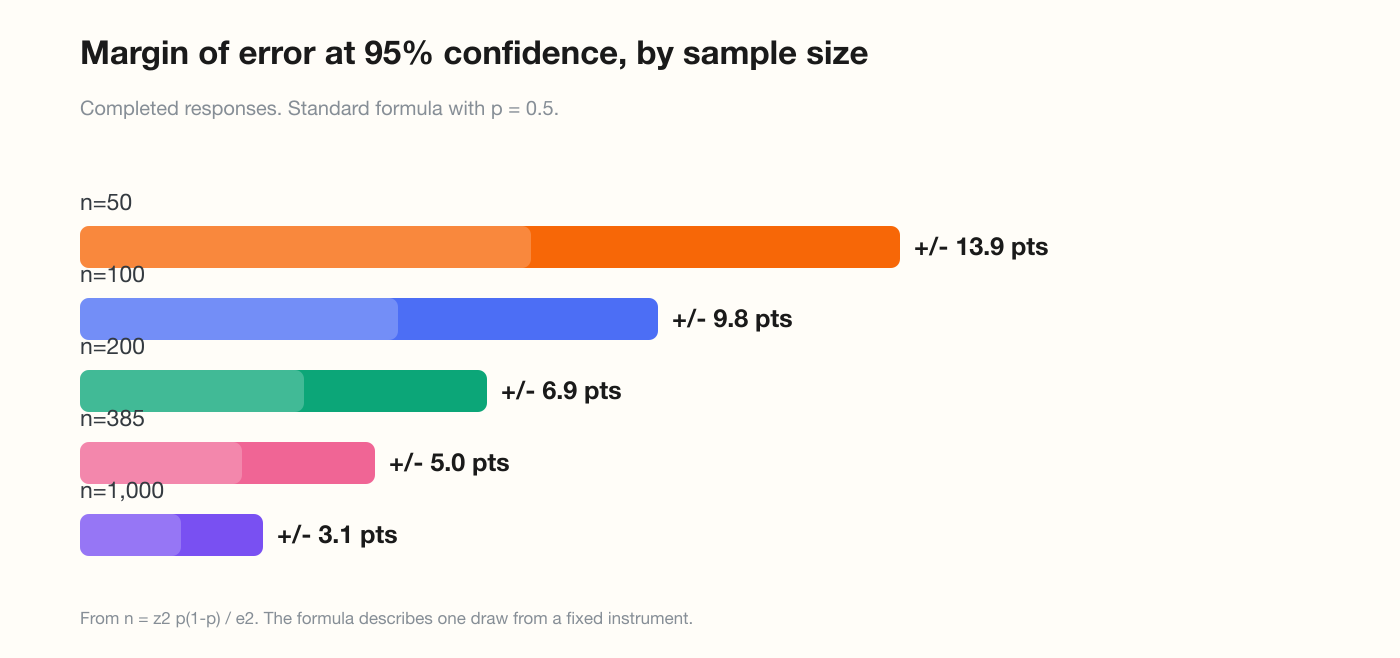
n = z² × p(1 − p) / e²
With p = 0.5 (the conservative assumption when you do not know the split), z = 1.96 for 95% confidence, and e as your target margin:
| Target margin of error | Completed responses needed |
|---|---|
| ±10% | 97 |
| ±5% | 385 |
| ±3% | 1,068 |
| ±2% | 2,401 |
Three features of this table cause most of the confusion in practice.
It counts completes, not invitations. Panel studies lose respondents at every stage: no response, partial response, failed attention check, quota already full. If you budget for 385 completes, budget for more invitations, and add quota overage on top.
Population size barely matters. Sampling 385 people out of a 10,000-person community and 385 out of 260 million adults gives you almost the same precision. The intuition that "we only surveyed 385 out of millions" is correct and irrelevant.
It assumes p = 0.5. If you expect roughly a 70/30 split, a smaller sample achieves the same margin. Everyone uses 0.5 because it is the worst case, not because it is expected.
And then the assumption that these calculators never mention: the formula describes the precision of a single measurement, given that the thing being measured is stable. In a survey, "the thing being measured" includes the question wording, the answer options, and the context in which they were asked. If any of that changes between runs, the formula is answering a narrower question than the one you asked it.
What we measured instead
We froze a design in advance: one neutral two-option tagline question, the same audience, run at five sample sizes. Full design, pre-registration and raw rows.
| Sample size | Option A | Option B | Neither | Lead |
|---|---|---|---|---|
| 50 | 54.0% [40.0, 68.0] | 44.0% [30.0, 58.0] | 2.0% [0.0, 6.0] | +10.0 |
| 100 | 52.0% [42.0, 62.0] | 42.0% [32.0, 52.0] | 6.0% [2.0, 11.0] | +10.0 |
| 200 | 58.5% [51.5, 65.0] | 37.5% [31.0, 44.5] | 4.0% [1.5, 7.0] | +21.0 |
| 500 | 49.6% [45.2, 54.0] | 44.0% [39.6, 48.4] | 6.4% [4.4, 8.6] | +5.6 |
| 1,000 | 49.1% [46.0, 52.1] | 45.6% [42.6, 48.8] | 5.3% [4.0, 6.7] | +3.5 |
Brackets are bootstrap 95% intervals computed from the per-respondent rows.
At n=50, the interval on Option A spans 28 points — from 40% to 68%. That is the textbook working as designed: a small sample gives you a wide interval, and the interval is honest about it. At n=1,000, the interval is 6 points wide. Precision improved roughly as the square root of sample size predicts.
Now compare the two runs a buyer would most likely treat as authoritative. At n=200, Option A was 58.5%, interval [51.5, 65.0]. At n=1,000, it was 49.1%, interval [46.0, 52.1]. The intervals do not overlap, so the 9.4-point difference is not sampling noise. Either the population changed, or the instrument did — and in this case the instrument did: the platform regenerated the questionnaire, and the fielded stem was a different sentence each time.
We cannot fully separate those two causes, and we say so in the companion study. What we can say is the part that matters for a sample-size decision: the total uncertainty on a number from this pipeline is larger than the interval printed beside it.
What more sample actually buys
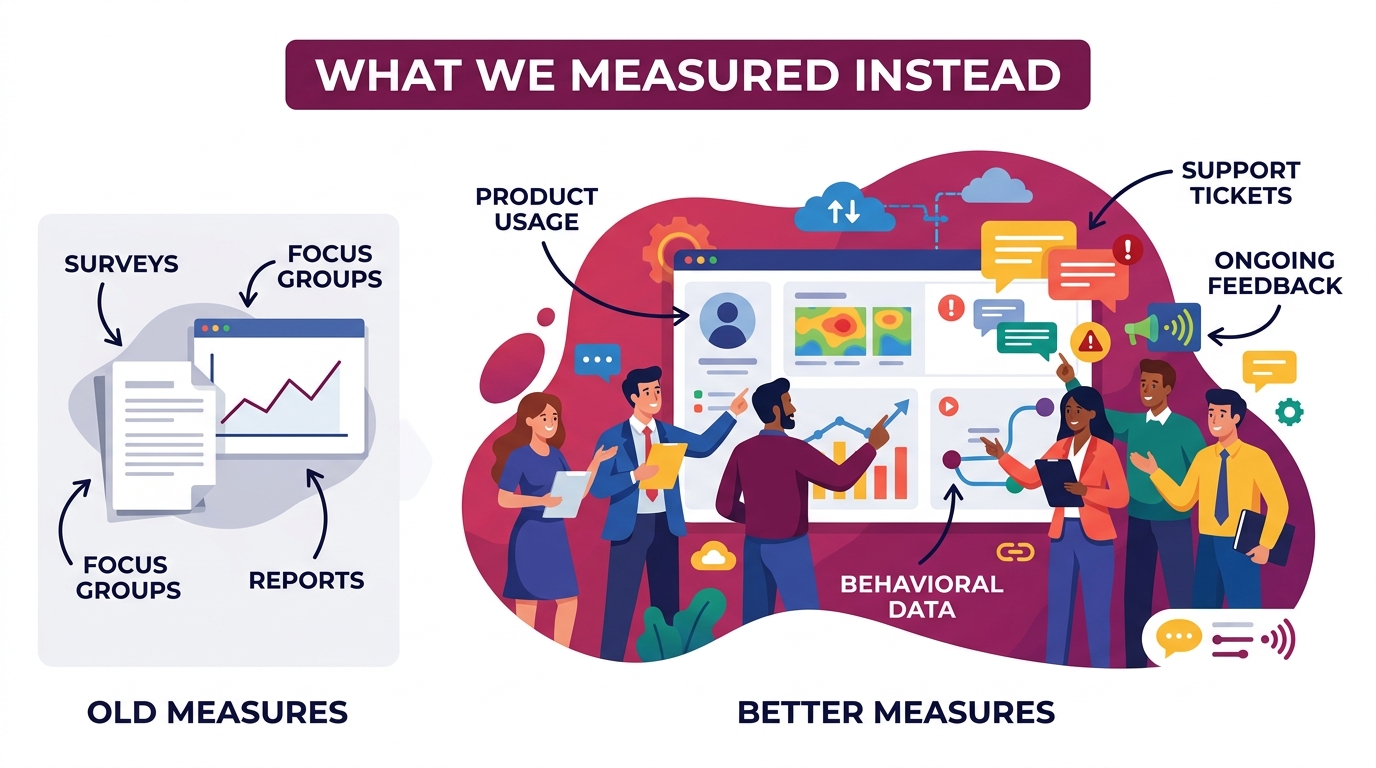
This is not an argument against sample size. It is an argument about what you are purchasing.
| What you buy | Does more sample help? |
|---|---|
| Narrower interval on one draw | Yes, predictably, as the square root of n |
| Ability to detect a 2-point difference | Yes, if the difference is stable |
| Stability of the point estimate across runs | No. In our sweep the estimate moved more than the interval |
| Coverage of a subgroup the pool barely contains | No. Weighting cannot create respondents who were never drawn |
| Comparability between a run and the next one | No. That is a property of the instrument, not the sample |
The third row is where budgets go wrong. A team that sees a 21-point lead at n=200 and a 3.5-point lead at n=1,000 will usually conclude that the larger sample "corrected" the smaller one. That is the wrong lesson. The larger sample did not reveal the true value; it removed some sampling noise from a pipeline whose other variance component is larger than the noise it removed. The honest summary of our sweep is that the true lead is somewhere in the range this pipeline produces, and this pipeline's range is wider than its intervals suggest.
If a decision hinges on a lead under about 10 points, sample size is not the tool that resolves it. Repetition is.
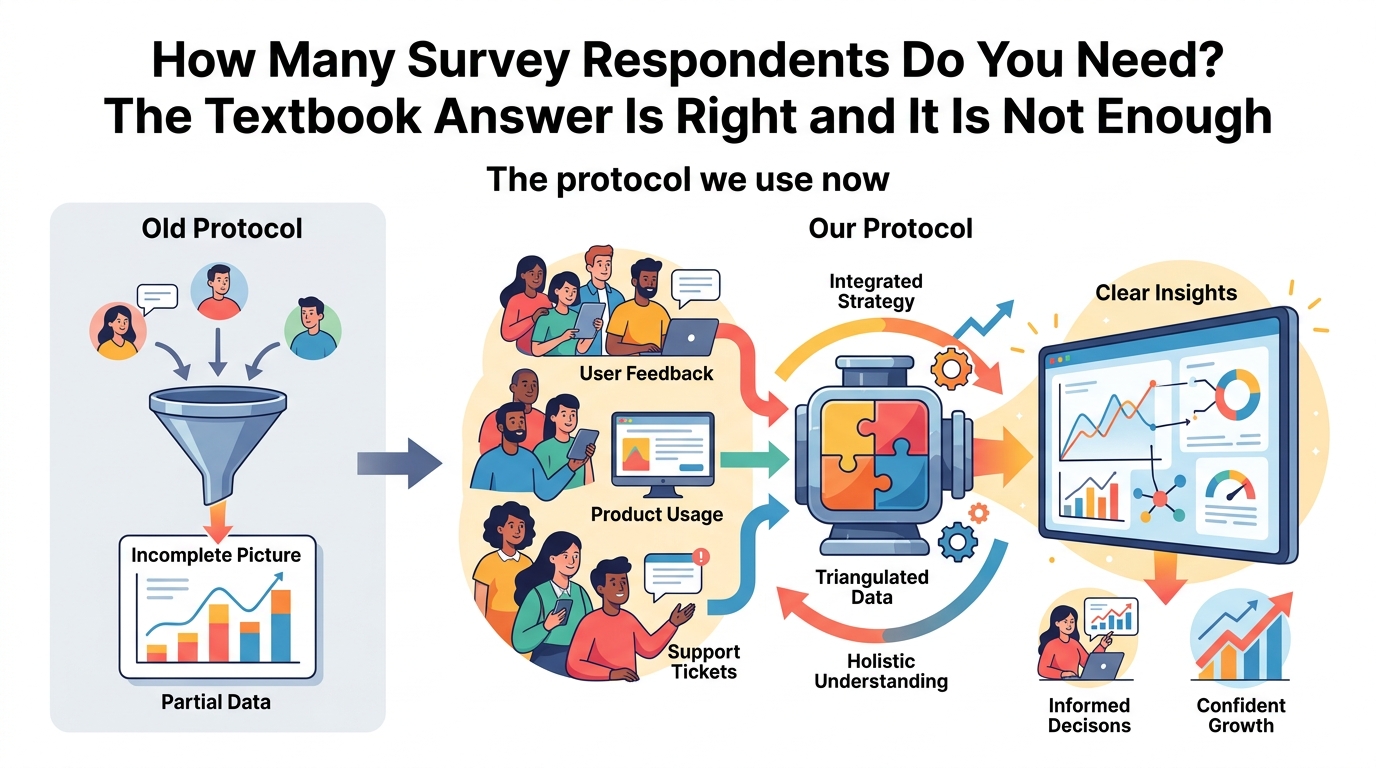
The protocol we use now
For a decision-relevant number, in order:
- Run it once at a moderate sample. 200–300 is enough to see whether the question is answerable and whether the options split.
- Run it again, unchanged. Do not touch the goal text. If the platform prints the fielded stem, check that it is the same; if it is not, the two runs are different studies.
- Compare the two runs, not the intervals. If the leader is the same and the shares are within a few points, you have a directional answer you can act on. If the leader changes hands, you have a real finding: the question is close, and no sample size will make it not close.
- Only then buy sample size — and buy it to shrink the interval on a number you already know is stable, or to power a subgroup analysis.
- Publish the spread alongside the interval. A single interval without a repeat range overstates precision, which is the failure this whole exercise found.
Deciding by decision type
| Your decision | Minimum useful design | Why |
|---|---|---|
| Which of two options is directionally preferred | One run, n=200–300 | You need a direction, not a decimal |
| Whether a small lead is real | Two or three identical runs at the same n | Repetition, not size, resolves this |
| A precise benchmark you will quote | n≈1,000 plus a fixed instrument you can reuse | The number must be reproducible, not just precise |
| A comparison between two segments | Check the pool's coverage of both segments first | A wide interval on a thin stratum is not the binding problem |
| A trend over time | Fixed instrument, identical each wave | A regenerated questionnaire makes the trend uninterpretable |
The third row deserves emphasis, because it is the one people skip. A precise number from an instrument you cannot reuse is a one-off. If the goal is a statistic you will cite for a year — in a pitch, a report, a press enquiry — the fixed instrument matters more than the sample size, and it is worth asking for before you buy.
Limitations
One item, one platform, eight runs. The sweep used a neutral two-option tagline question on our own product; order effects, wording effects and run-to-run variance are all expected to differ on longer instruments and on scales. Nothing here replaces the standard formula for a study with a fixed instrument and a stable population.
Sample size and instrument regeneration are confounded. The platform regenerates the questionnaire from the submitted goal, so we could not hold the instrument fixed while varying n. The 9.4-point movement is attributable to something other than sampling error; separating instrument drift from draw-to-draw variation would require holding one fixed, which this design could not do.
The textbook numbers are still correct. 385 for ±5% is right, for the question it answers. The failure is in treating it as an answer to a different question.
A thin stratum is not a sample-size problem. Where the underlying pool barely contains a group, more sample makes its interval narrower without making its estimate more accurate — a bias is not reduced by precision.
Frequently asked questions
So is 385 still the number? Yes, for a single measurement with a fixed instrument and a ±5% target. It is not a ceiling or a floor — it is the precision you buy, priced in completes.
Do I need 1,000 responses to publish a statistic? No, but you need something more than a number: a published instrument, a stated population, a fielding date, and rows someone can re-add. A well-documented 300-respondent study is more citable than an undocumented 3,000-respondent one.
Why did the larger sample give a smaller lead? Because the point estimate moved between runs for reasons unrelated to sample size. The larger sample did its job; the pipeline's other variance source was doing more.
How many times should I re-run before trusting a number? Twice is enough to detect the failure we found. If the two runs disagree on the leader, the honest conclusion is that the question is close, and that is a legitimate answer to bring to a decision meeting.
Does this apply to human panels? The repetition argument applies to any study. The instrument-regeneration problem is specific to platforms that generate their own questionnaire from a prompt — a panel study with a fixed instrument does not have it, which is one reason its single-run interval is more trustworthy.
Disclosure
MoeVox is our product; all eight runs were commissioned on it and paid for in credits (2,650 in total). Two findings here reflect badly on the platform — an interval that understates run-to-run variance, and a questionnaire regenerated between runs — and both are published with the runs that produced them. The textbook sample-size formula is standard and not ours; the sweep is.
Sources
- The eight runs, fielded stems, and per-respondent rows: research-data/design-sensitivity.json
- Pre-registration for the sweep and its controls: research-data/preregistration.md
- Companion study: One Question, Eight Runs, Four Different Answers
- Companion study: What a Survey Actually Costs