
The Bill of Materials for One Citable Statistic
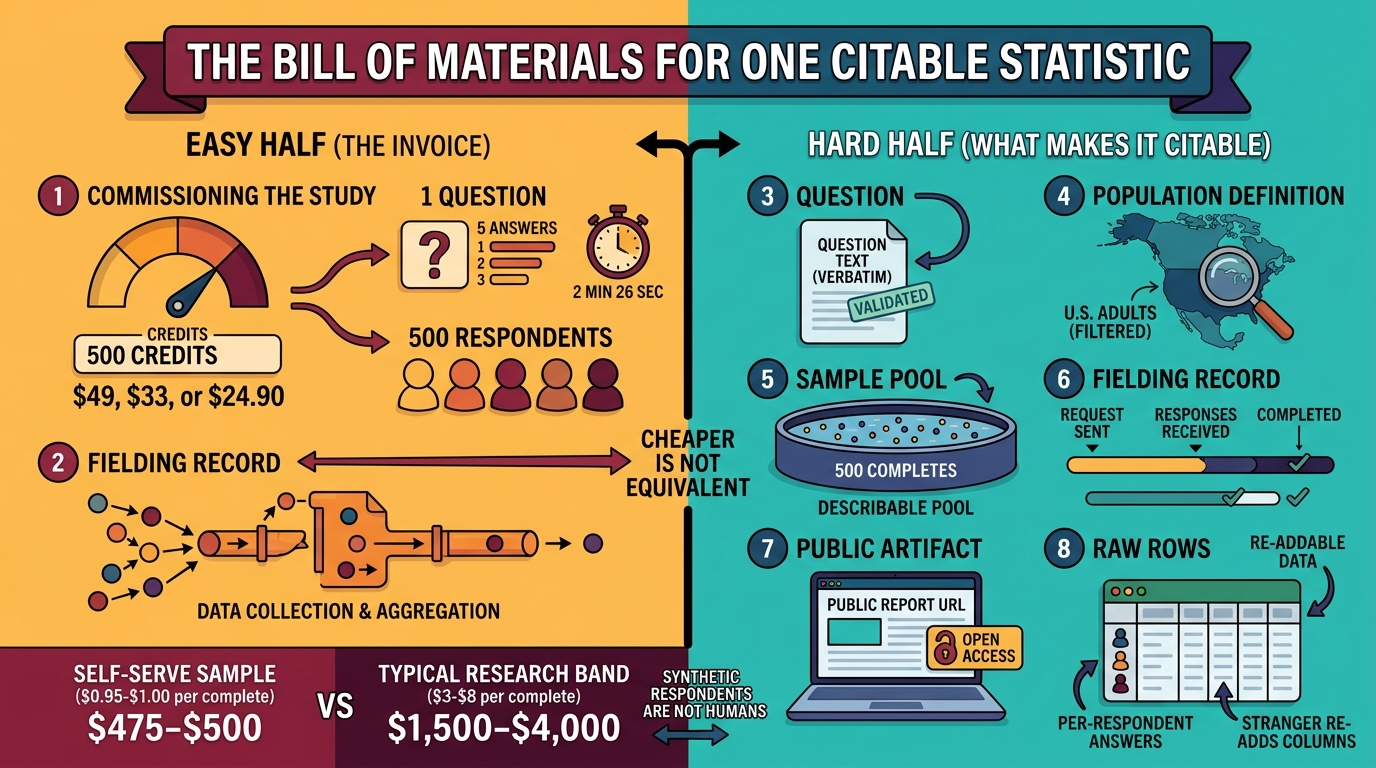
A number you can cite has parts, and they can be itemized: a question, a sample drawn from a documented pool, a fielding record, a public report, and raw rows anyone can re-add. Here is the invoice for one study that took 2 minutes 26 seconds.
By Alex Li, Founder · Contact the author
On 15 September we commissioned a study with one question and five answer options. It reached 500 respondents, produced a report with a public URL, and finished 2 minutes 26 seconds after the request was sent. It consumed 500 credits.
That is the easy half of the invoice. The hard half is everything that makes a number citable rather than merely printed — the parts a reader needs before they can repeat your statistic without taking your word for it. This article itemizes both halves, using that study as the worked example, and then says plainly where the arithmetic stops being a like-for-like comparison.
The short version
- A citable statistic has six parts: a question, a population definition, a sample drawn from a pool you can describe, a fielding record, a public artifact, and raw rows that let a stranger re-add the columns.
- The study below cost 500 credits, which is $49, $33, or $24.90 depending on which credit pack you buy, and 2 minutes 26 seconds of wall clock. The free tier covers a 100-respondent version.
- The cheapest published self-serve consumer sample in North America starts at $0.95–$1.00 per complete (Pollfish, SurveyMonkey Audience). At that floor, 500 completes is about $475–$500. The typical consumer research band is $3–$8 per complete, which puts the same 500 at $1,500–$4,000.
- Cheaper is not the same as equivalent. Synthetic respondents are not humans, and the price gap is a statement about the method, not a discount on the same product.
- The part most vendors leave off the invoice is the cheapest one to include and the only one that makes the number usable by someone who does not trust you: publishing the instrument, the sample size, the population string, and the per-respondent answers.
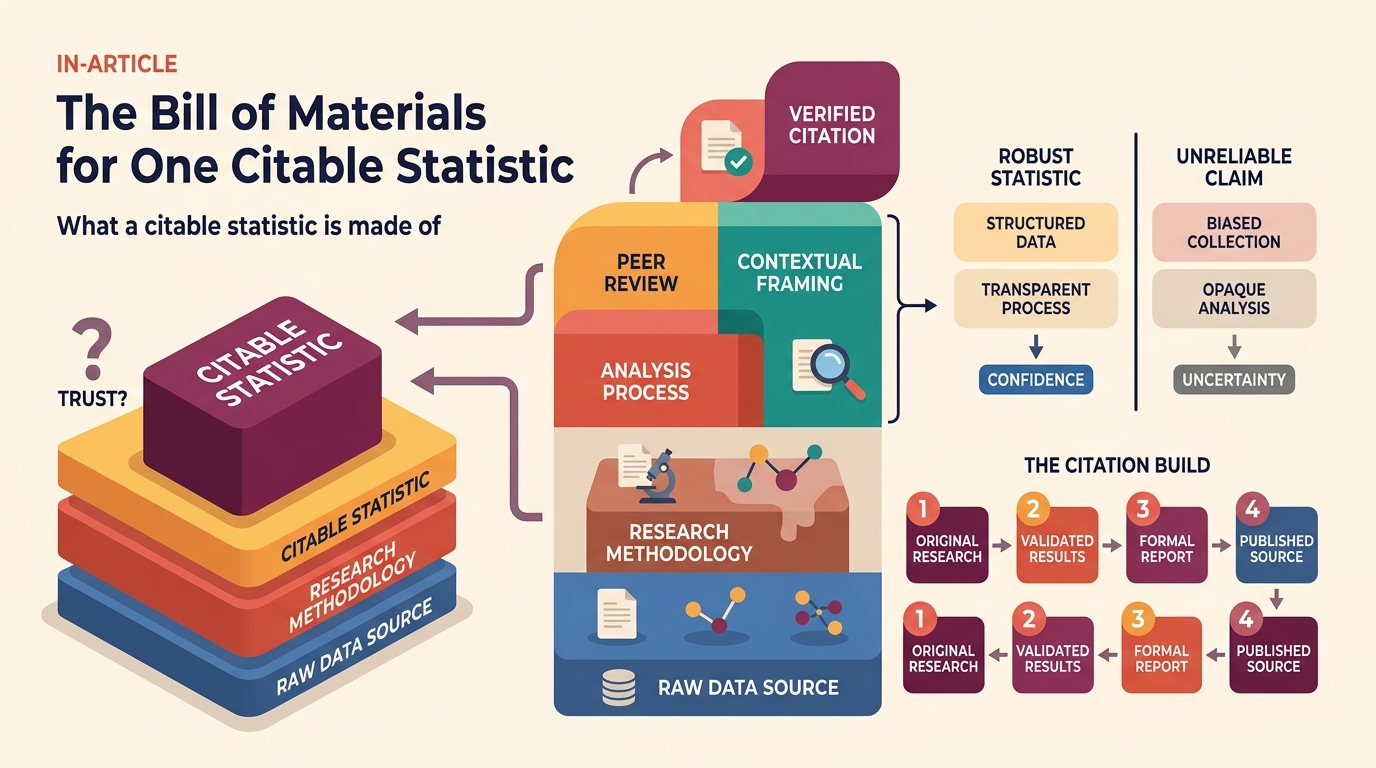
What a citable statistic is made of
"Original data" is usually discussed as a single asset. It is not. It is an assembly, and the parts fail independently. When a reader cannot check a number, it is usually not the statistics that are missing — it is one of these six parts.
| # | Part | What it answers | How a reader checks it |
|---|---|---|---|
| 1 | The instrument | What exactly was asked, in what order, with which options | The question text and option list are printed |
| 2 | The population definition | Who the number is supposed to describe | A one-line audience string, quoted verbatim |
| 3 | The sample | Who actually answered, and from where | Sample size, the pool it was drawn from, and the drawn records |
| 4 | The fielding record | When it ran and whether it finished | A creation timestamp, a completion timestamp, a completion rate |
| 5 | The public artifact | Where the result lives outside your blog | A report URL that returns 200 without a login |
| 6 | The raw rows | Whether the headline number can be re-derived | Per-respondent answers, published, so the percentages can be re-added |
Parts 1, 2, and 4 cost nothing to publish. Part 5 costs a page. Part 6 costs a decision, because raw rows are where awkward facts live — the subgroup that contradicts your narrative, the answer nobody expected, the stratum that is missing. That decision is the one worth examining, and it is the one this article's invoice is really about.
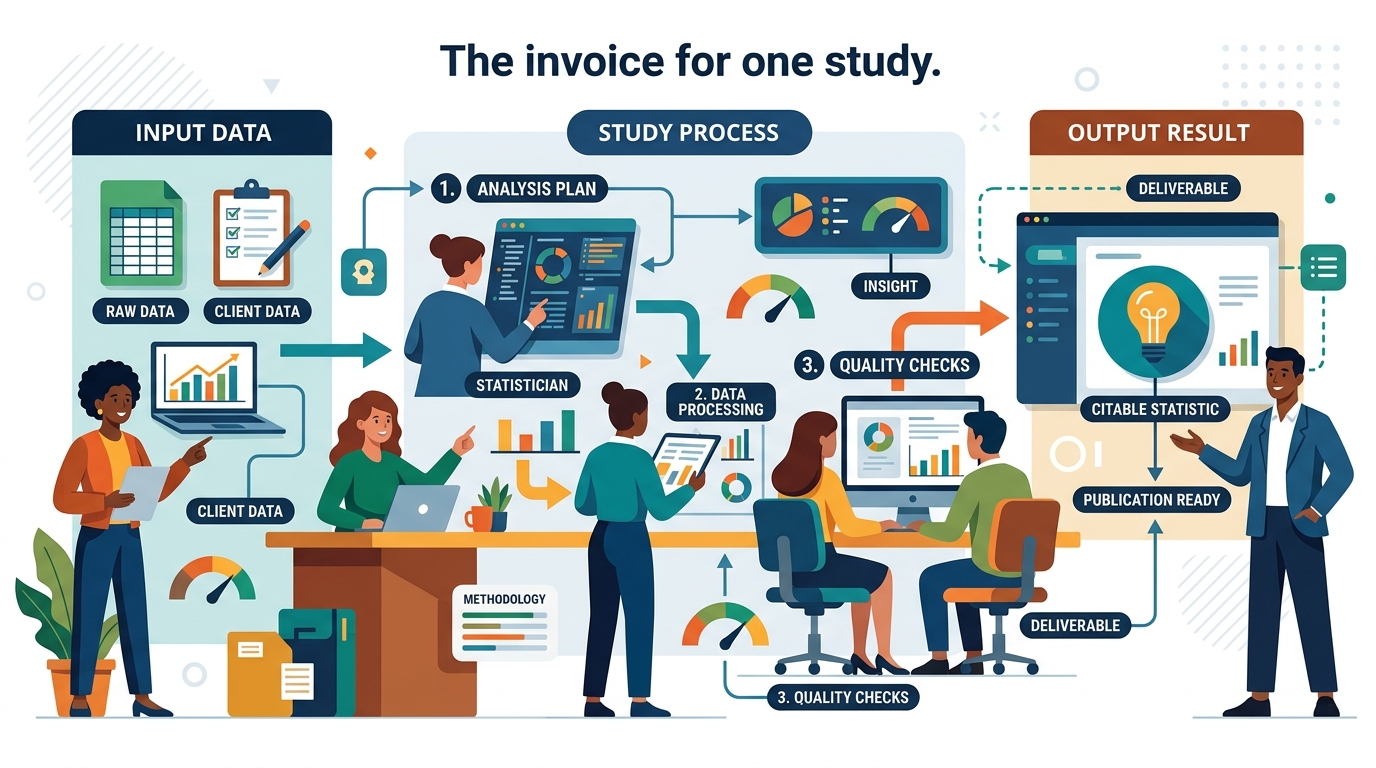
The invoice for one study
The study: When an AI assistant answers your question, which of these makes you trust its answer most? Five options, one choice, US adults aged 18–65 who use an AI chatbot at least once a week.
| Line item | Value |
|---|---|
| Human input | 1 paragraph: the question, the five options, the audience string |
| Questionnaire generated by the platform | 10 questions (1 primary decision question, 1 driver, 1 structured risk, 1 open-text risk, 6 support items) |
| Candidate records matching the audience | 96,162 |
| Records drawn | 500 |
| Completed | 500 |
| Failed | 0 |
| Completion rate | 100% |
| Wall clock, request to finished report | 145.7 seconds |
| Credits consumed | 500 (1 credit = 1 synthetic respondent) |
| Cost at the 1,000-credit pack ($98) | $49.00 |
| Cost at the 3,000-credit pack ($198) | $33.00 |
| Cost at the 10,000-credit pack ($498) | $24.90 |
| Public artifact | moevox.com/report/…aqiTh1nIu1JNDaON |
Three things in that table are worth pausing on.
The candidate pool is the line item nobody quotes. 96,162 records were eligible for an audience that is a narrow slice of US adults — weekly AI chatbot users aged 18 to 65. That number is the study's binding constraint, and it is also its most useful disclosure: it is the pool a reader would need in order to argue that the sample is wrong. A study that reports a sample size but not the eligible pool is asking you to trust the draw without showing you the urn. (What happens when the pool is thin is the subject of the companion study — we found two strata it does not cover well, and we published the per-respondent records that show it.)
The questionnaire is generated, not dictated. We supplied one goal and five options; the platform wrote the instrument around it, including six support questions we did not ask for. This cuts both ways, and both directions belong in the invoice. It means a marketer can go from a decision to a fielded study without writing survey items — and it means the wording of the primary question is not fully under your control. In this run the submitted stem was rewritten to "Which of the following factors most significantly increases your trust in the accuracy and reliability of an AI assistant's response?" Same options, different sentence. If your claim depends on exact wording — a replication of a published poll, say — that difference is a real cost, and it should be disclosed rather than smoothed over.
Zero failures is not a boast. 500 of 500 completed with nothing dropped. That is what a synthetic sample looks like when the "respondents" are records rather than people. Real panels have attrition, speeders, and straight-liners; a completion rate of 100% is a signal that you are not measuring human behaviour — you are generating answers from a described population. That is a legitimate method, but it is a different method, and the invoice should not let the number imply otherwise. It is also not a guarantee from run to run: a later 500-respondent run in the study linked below lost exactly one respondent and returned an elevated failure-rate warning with it.
What the same study costs without an API
The comparison below is compiled from vendor-published pages rather than from a single price list, because no such price list exists. Every figure is traceable to the page named beside it.
| Tier | Published cost per complete | 500 completes | Source |
|---|---|---|---|
| Cheapest self-serve consumer sample | $0.95–$1.00 | $475–$500 | Pollfish pricing ("starting at $0.95"); SurveyMonkey Audience ("starting at $1 USD per response") |
| Typical North American consumer quant | $3–$8 | $1,500–$4,000 | Compiled range; see the source list below |
| Deep-screened consumer, longer questionnaire, tighter quotas | $8–$20 | $4,000–$10,000 | Same compilation |
| B2B professionals, managers, buyers | $20–$50 | $10,000–$25,000 | Same compilation |
| Low-incidence specialists | $50+ | $25,000+ | Same compilation |
The bands above $1 are a compilation rather than a quote from one vendor, and it is worth being explicit about what that means: they reflect how price moves with questionnaire length, incidence rate, and quota complexity, which is why the same "consumer study" can be $1 or $15 per complete. The cheapest published consumer sample and the typical consumer study are not the same product, and a comparison that uses only one of them is a rhetorical choice, not a finding.
So the honest arithmetic runs like this:
- Against the floor of published self-serve sample pricing ($0.95–$1.00), a 500-complete synthetic study at $24.90–$49 is roughly 10 to 20 times cheaper.
- Against the typical consumer band ($3–$8), the same study is roughly 30 to 160 times cheaper.
- Against B2B or specialist sample ($20–$50+), the gap is larger still, and the comparison becomes almost meaningless because the two products are answering different orders of question.
And then the sentence that has to follow it: none of those numbers is a like-for-like price comparison. A panel pays humans to answer. This platform generates answers from US Census Bureau ACS PUMS records — 100,000 of them, each carrying demographic attributes and behavioural trait labels — and draws a sample that matches the audience you described. Whether that is a substitute depends entirely on the question. For ranking two taglines among a described audience, it is a reasonable stand-in. For measuring a behaviour that people misreport, it is not, and our own smoking test in the companion study shows synthetic respondents missing that benchmark too.
The line item that costs nothing and gets omitted
Everything in the cost discussion above is a race to the bottom. The part that actually decides whether a statistic gets cited is not the price per complete — it is whether a stranger can check the work.
Consider what an editor does with a number that arrives in a pitch: "49.8% of weekly AI chatbot users say they trust an answer most when it explains its reasoning." The instinct is to look for the study. What the editor needs, in order:
- Does the report URL resolve without an account?
- Is the exact question printed, with its options?
- Is the fielding date stated?
- Is the population string quoted verbatim, or paraphrased into something broader?
- Can the percentage be re-derived from published rows?
Four of those five cost nothing but the decision to publish them. The fifth — per-respondent rows — is the one that makes the rest more than a claim.
We publish all five, in the report behind that study. It is our own platform, so this is not a modest claim: it is the minimum we would have to do for the number to be usable by someone who has no reason to trust us. But it is worth naming as a product decision, because it is the one line item that does not shrink with scale. Generating another 500 respondents is cheap. Publishing them means living with what they say.
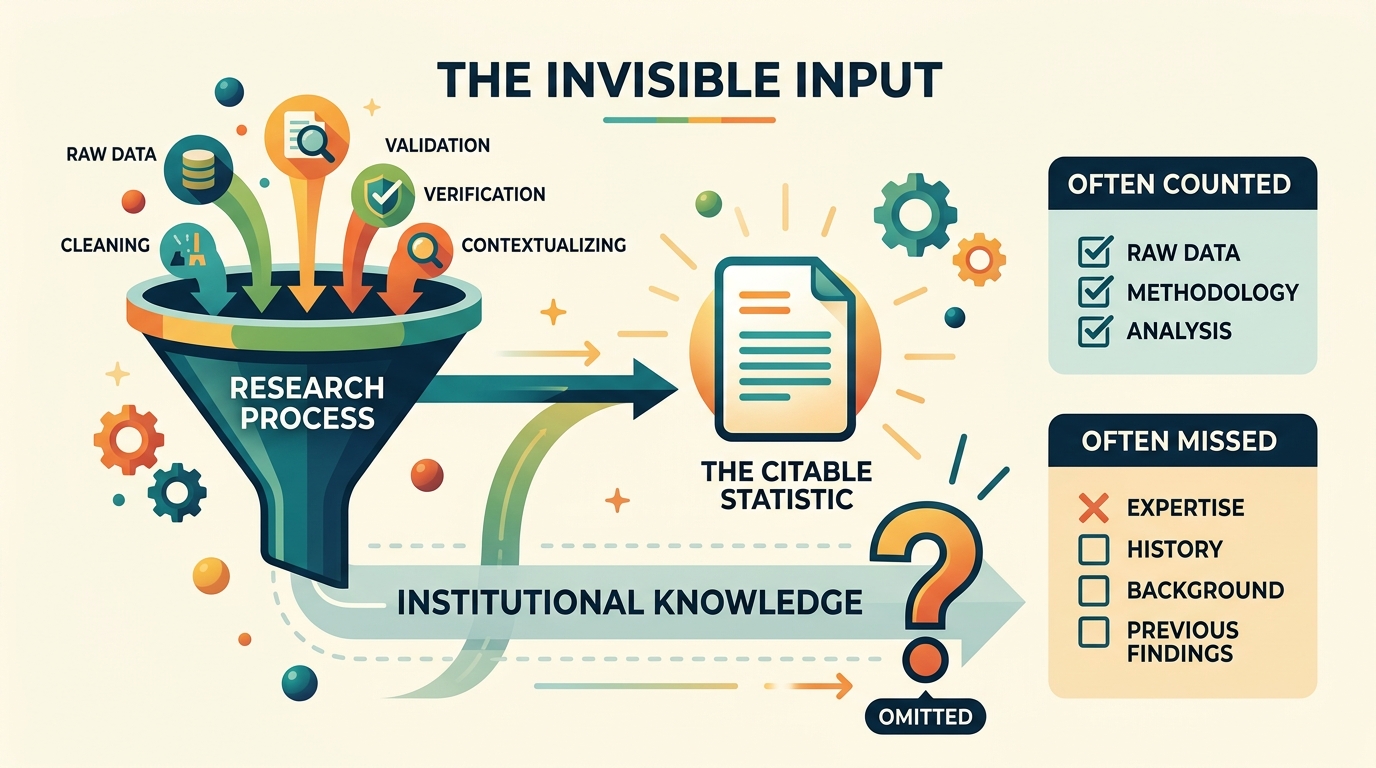
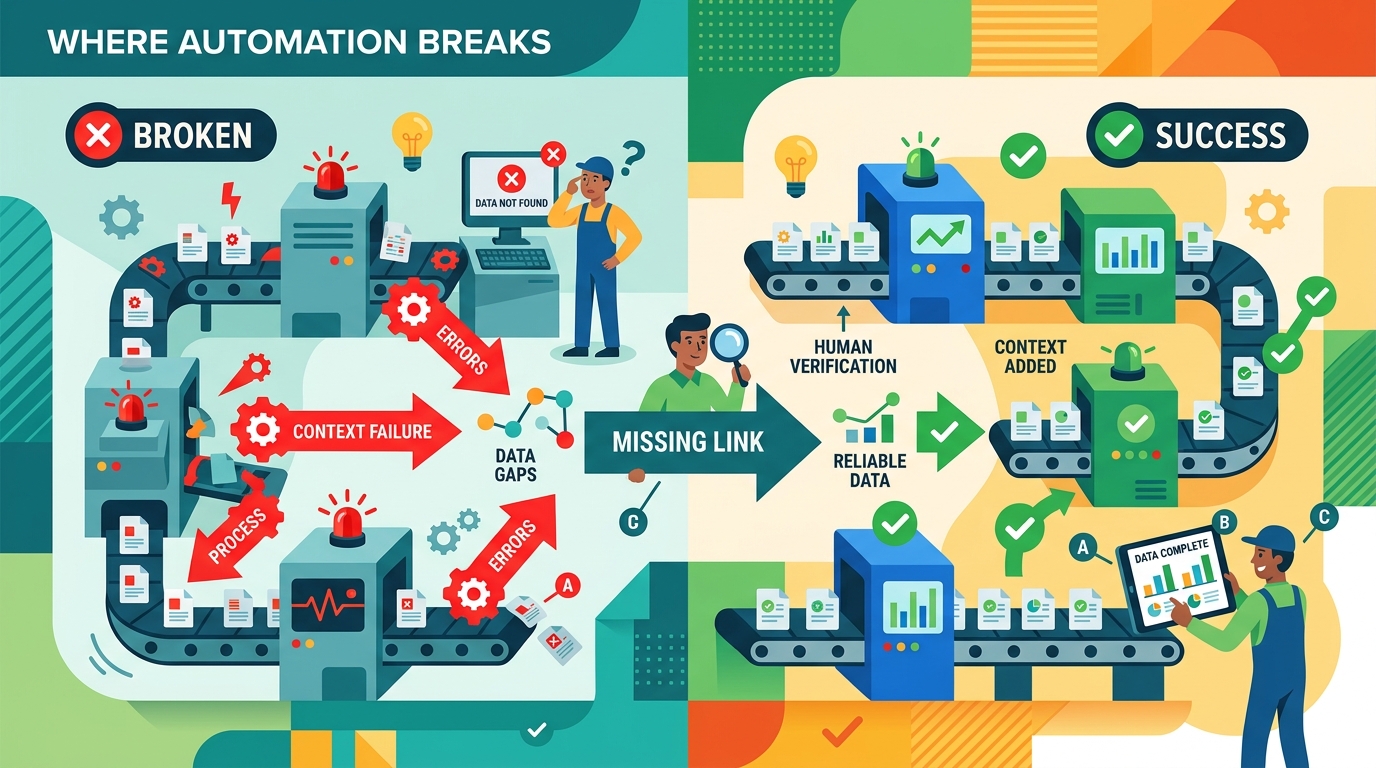
Where automation breaks
We run our own content pipeline on this API. It commissions a study automatically when an article needs one, then writes the article around whatever comes back. Two design decisions in that pipeline are more interesting than the cost.
It refuses to recompute. The pipeline may cite numbers the platform explicitly returned — the winner's share, the sample size — and is forbidden from summing, re-deriving, or inferring any other figure from the report. This exists because a generated article is exactly the kind of system that invents a plausible denominator. The rule is a guardrail against the model's own fluency.
It degrades instead of failing. If the questionnaire cannot be designed for a given topic, if the credits are short, if the API times out, the article is written without the survey rather than blocked on it. The failure mode is a normal article with no original data, not a broken pipeline.
Both choices are about the same risk: an automated research step that fails loudly is easy to notice, and one that fails quietly produces a confident paragraph with a fabricated number in it. If you are wiring a research API into a production system, the second failure mode is the one to design against.
How to audit a statistic someone sends you
Five minutes, six questions. This applies to a vendor's number as much as to ours.
| Check | Fail condition | Why it matters |
|---|---|---|
| Is the instrument public? | You can see a chart but not the question | A chart without the stem cannot be compared to anything |
| Is the population string quoted verbatim? | "Americans" when the sample was weekly chatbot users | The broader phrase is usually a bigger claim than the study |
| Is the eligible pool disclosed? | Sample size yes, pool no | The draw is unverifiable without the urn |
| Are per-respondent rows published? | No | The headline cannot be re-derived, so errors cannot be caught |
| Is the fielding date stated? | No | Numbers about behaviour age badly |
| Is there more than one way the number could have been computed? | Yes, and only the flattering one is shown | The choice of denominator is where most honest errors live |
A study that passes all six is still capable of being wrong. It is just wrong in a way that a reader can find — which is the most you can ask of anyone's data, including your own.
Frequently asked questions
Is 500 respondents enough? It depends on the effect you are claiming, and the honest answer is a range rather than a number. What matters more at small samples is the stability of the leader, not the exact share: if a 6-point lead is the whole finding, a 500-respondent sample can move it by more than that between runs. We measured how the leader behaves across sample sizes in the design-sensitivity study rather than asserting a threshold here.
Why is the free tier 100 respondents? Because 100 is enough to see whether a question is answerable and not enough to publish a number from. That is deliberate: it makes the first experiment free and the first claim paid.
Can I publish a MoeVox report as a citation in a media pitch? Yes, and the report URL is the point. It resolves publicly, prints the instrument, and exposes the respondent rows. An editor can check it without an account, which is the only version of this that survives contact with a fact-checker.
Does a cheaper statistic mean a worse one? Not automatically, and not in the direction people assume. It means the parts of the process that were expensive because they involved paying humans are replaced by parts that are cheap because they involve records. Where those records are thin, you lose more than money — you lose the ability to make claims about that group at all. That is what the frame audit is for.
What is the actual cost of a study that gets cited? The study is the cheap part. The expensive part is the disclosure around it — the public report page, the published rows, and the willingness to publish the subgroup that contradicts you. Budget for that instead of for sample.
Disclosure and limitations
The platform measured in this article is our own product. We ran the study on it, we publish its report, and we sell credits. The panel prices above are compiled from vendor-published pages and are a price range, not quotes for a specific project; agency-managed projects typically cost more than the sample alone. The 145.7-second figure is one run on one question, not a benchmark — a 1,000-respondent study takes longer, and a questionnaire that is difficult to design can fail entirely. Finally, the comparison between synthetic and human samples is a comparison of inputs, not of accuracy; the companion study reports where our own sample missed published benchmarks, which is a more useful number than the price.
Sources
- The itemized ledger for the study in this article: moevox.com/research-data/chatgptgrow-ledger.json
- Pollfish pricing page, "starting at $0.95" per response — https://www.pollfish.com/pricing/
- SurveyMonkey Audience product page, "starting at $1 USD per response" — https://www.surveymonkey.com/product/features/audience-panel/
- U.S. Census Bureau, ACS PUMS 2024 — the demographic source the respondent pool is built from
- MoeVox credit pricing — https://moevox.com