
We Tested a Synthetic Sample Against Four Published Benchmarks. The Error Lives in the Pool, Not the Personas.
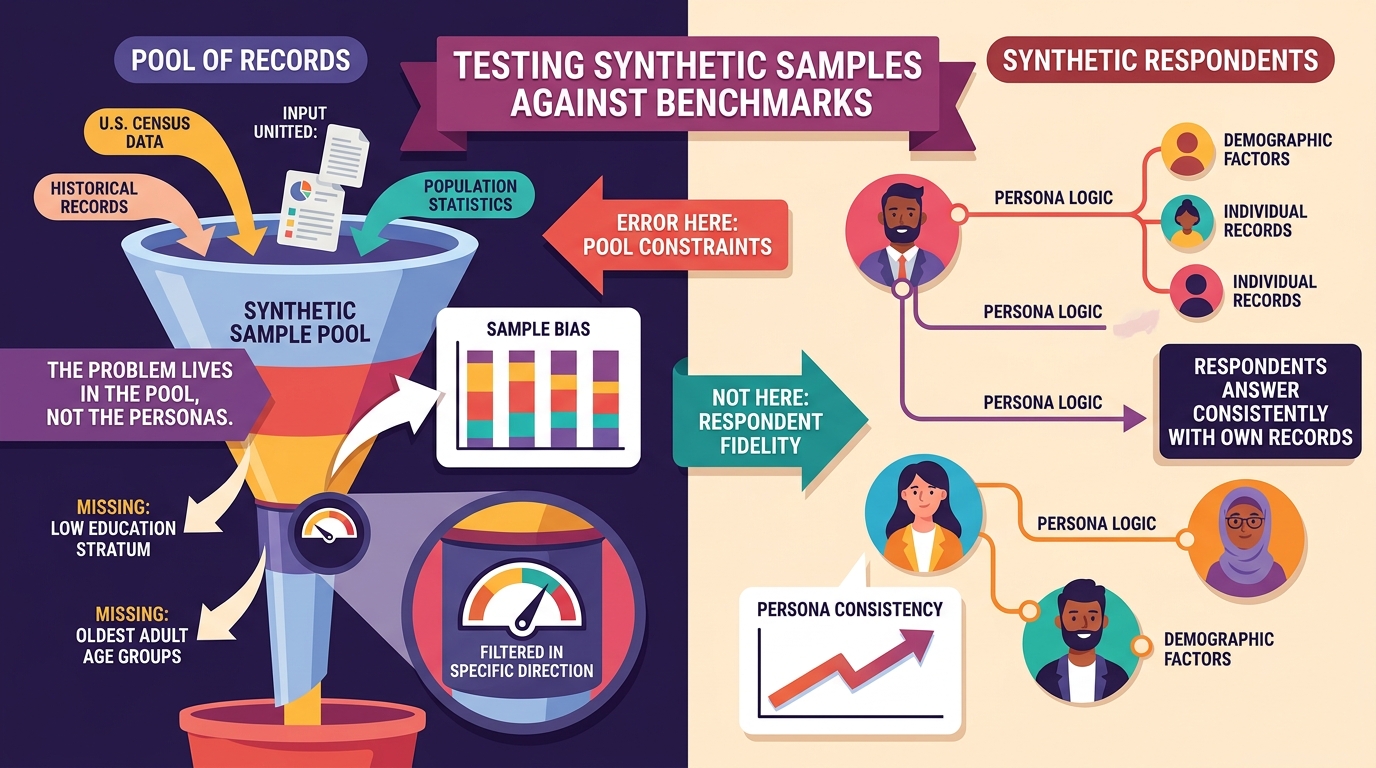
We asked a synthetic sample the same questions the US Census, the General Social Survey and the CDC ask. Two population groups are almost entirely absent from the records it draws from, while gender and region land within one point. The interesting part is where the mistake is not.
By Alex Li, Founder · Contact the author
There is a version of this study that would have been a product brochure, and we deliberately did not write it.
The public argument about synthetic survey data runs between two papers. Argyle and colleagues argued in Political Analysis in 2023 that language models can approximate human subpopulations well enough to stand in for them. Bisbee and colleagues answered in the same journal in 2024 that the approximation is fragile in ways that matter. Both sides argue about the personas — whether a model asked to be a 42-year-old nurse answers like one.
Our own data says that argument is aimed at the wrong layer, at least for the questions we tested. We ran four items with published national benchmarks through a synthetic sample built from US Census records. The respondents answered consistently with their own records 89% of the time. The error was somewhere else entirely: in the pool of records the sample was drawn from, which does not contain the lowest-education stratum of the adult population at all, and contains almost none of the oldest.
The short version
- The sample we drew had zero respondents whose own census record lists less education than a high school diploma. The American Community Survey puts that group at 10.1% of adults 25 and over. In a second run, also zero.
- Respondents aged 65 and over were 4.0% of the sample drawn for adults 25+. The ACS figure is 26.0%. A second run for adults 18+ put it at 2.1% against an ACS figure of 22.9%.
- Meanwhile gender and region were accurate to within one point, which matters: it means the pool is not sloppy. It is filtered in a specific direction.
- The synthetic respondents were not the source of the bias. 89.1% answered exactly as their own census record says. The 10.9% who diverged mostly moved one step.
- Adding a single option — "It depends" — moved our headline number by 12.4 points (29.2% → 16.8%), in the same direction and comparable magnitude to the 17.8-point swing the real General Social Survey itself documents between its two published versions of the same question.
- On that three-option version we landed within ±4 points of the real benchmark on every option, while a plain language model asked to produce the same distribution missed "It depends" by 26.5 points. On the two-option version, that same plain model beat us (2.2 points off vs our 8.0). Which method wins depends on whether the answer has ever been published.
- Three of our five pre-registered predictions held and two failed, and the two failures are the more useful half.
What we tested, and what we refused to do
We froze a pre-registration before the first report was created: four items, fixed sample sizes, five stated predictions with falsification conditions, and three rules that constrained the write-up rather than the measurements. One run per configuration. No rerunning a comparison to get a friendlier number. No picking a secondary question from the report that happened to land closer to the benchmark.
The second rule is the one that shaped this article. The platform we tested generates its own questionnaire from the goal you submit, and it rewrites the question stem. We submitted "Generally speaking, would you say that most people can be trusted or that you can't be too careful in dealing with people?" — the exact wording of a General Social Survey item asked since 1972. What got fielded was "Which of the following statements best reflects your view on interpersonal relationships?"
| Item | Benchmark source | Submitted goal | What was actually fielded |
|---|---|---|---|
| Education | ACS 2024 1-year, table B15003 | "What is the highest level of education you have completed?" | "Which of the following best describes your highest level of education completed?" |
| Trust, 2 options | GSS web administration | GSS wording, verbatim | "Which of the following statements best reflects your view on interpersonal relationships?" |
| Trust, 3 options | GSS web administration | Same, plus one option | "Which of the following statements best reflects your general view on interacting with others?" |
| Smoking | CDC / NHIS 2024 | "Do you currently smoke cigarettes?" | "Do you currently smoke cigarettes?" |
So this is an option-set-matched replication, not a wording-matched one. The option lists survived intact; the sentences around them did not. We publish both versions side by side because the alternative — calling it a replication and hoping nobody reads the report — is the failure mode this whole exercise is meant to avoid.
Two other method notes. Every percentage below was recomputed from the per-respondent rows and checked against the report narrative; they matched in all four runs. Confidence intervals are bootstrap percentile intervals from 10,000 resamples of those rows, fixed seed 20260915. And the "naive" comparison below is one general-purpose model answering from memory with no census grounding, five times per item, so the spread across repeats is visible.
The pool has two holes, and they are not the ones the debate argues about
Start with what the sample got right, because it frames everything else. Gender landed at 49.8% male / 50.2% female against ACS figures of 49.0 / 51.0. Region landed at 37.5% South, 24.6% West, 21.1% Midwest, 16.8% Northeast against ACS figures of roughly 38.0 / 23.9 / 20.7 / 17.4. Those are not lucky draws. Something in the pipeline is doing real matching work.
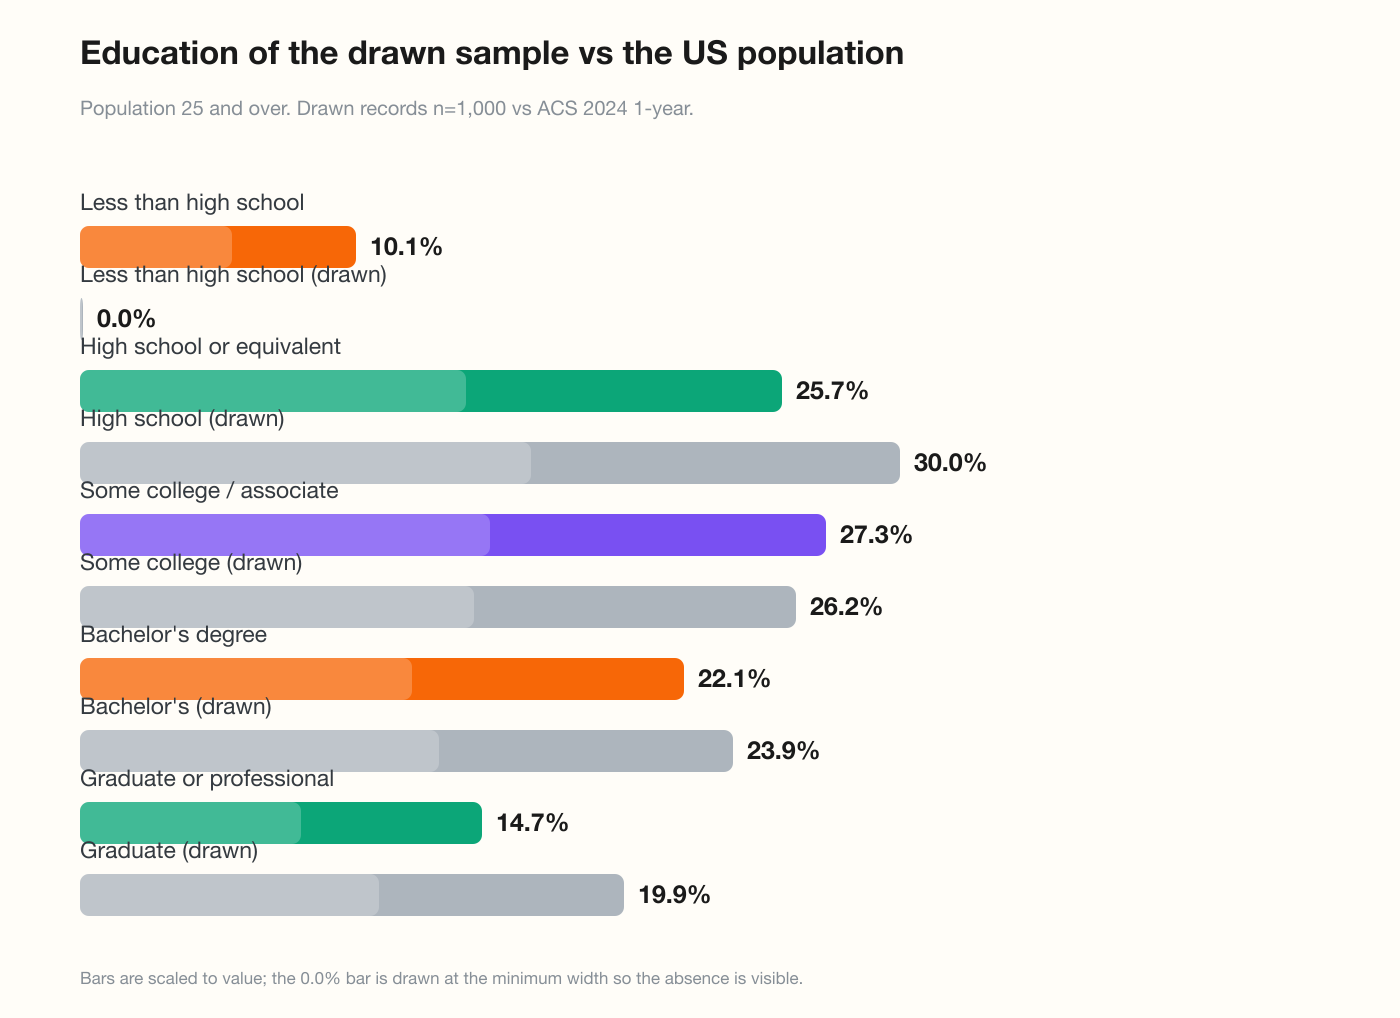
Then look at education, and specifically at the records the respondents were built from — not their answers, their records.
| Highest level completed | ACS 2024, age 25+ | Records drawn (n=1,000) | Difference |
|---|---|---|---|
| Less than high school | 10.1% | 0.0% | −10.1 |
| High school graduate or equivalent | 25.7% | 30.0% | +4.3 |
| Some college or associate degree | 27.3% | 26.2% | −1.1 |
| Bachelor's degree | 22.1% | 23.9% | +1.8 |
| Graduate or professional degree | 14.7% | 19.9% | +5.2 |
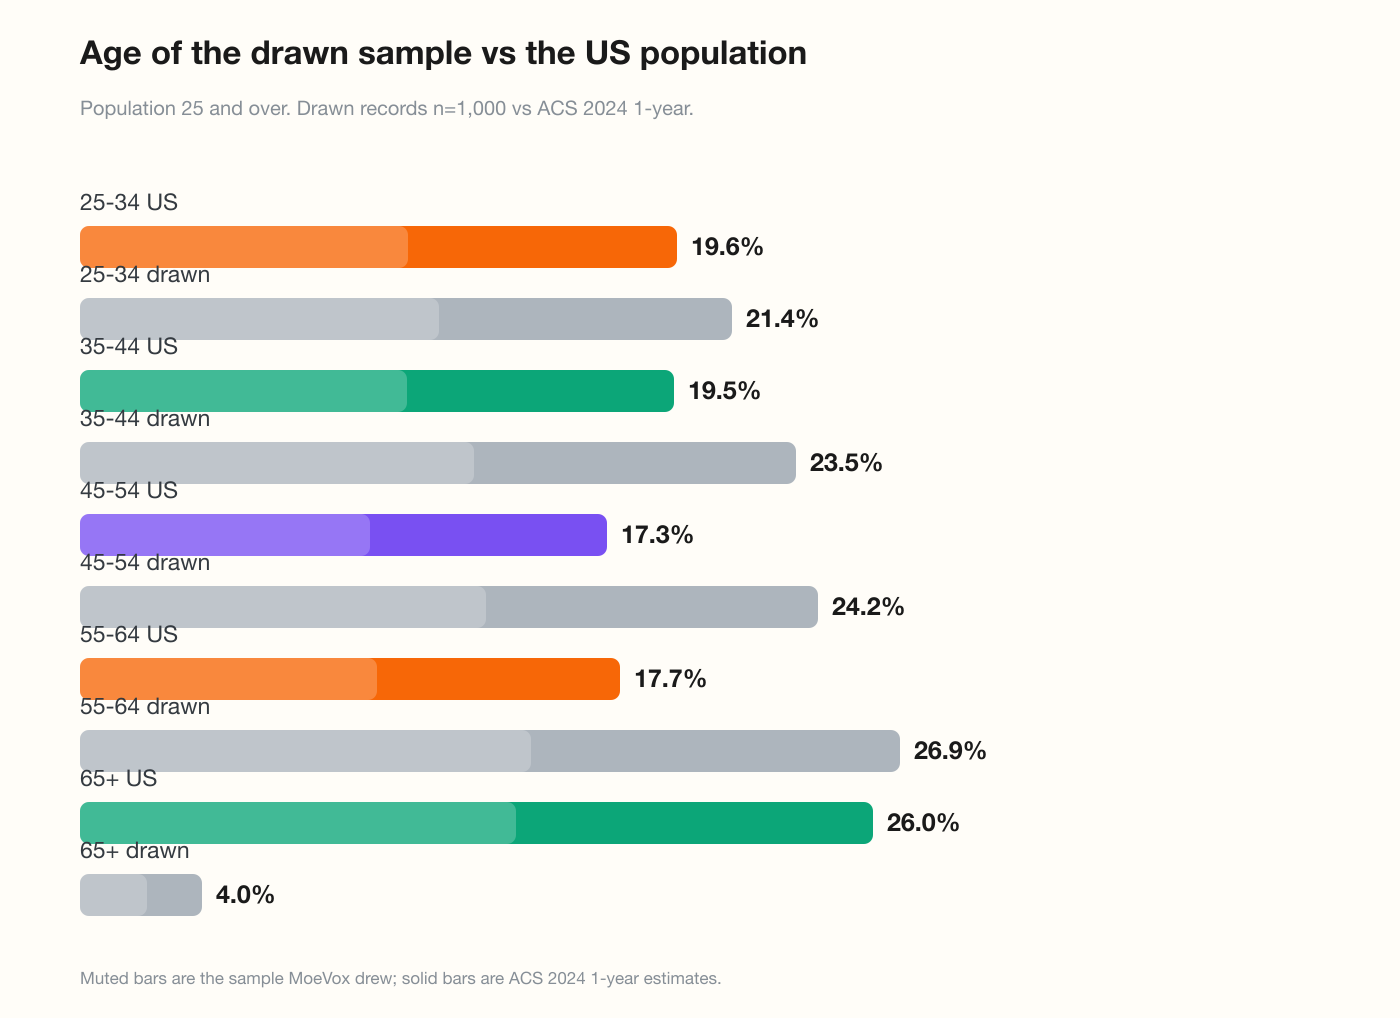
And age:
| Age band | ACS 2024, age 25+ | Records drawn (n=1,000) | Difference |
|---|---|---|---|
| 25–34 | 19.6% | 21.4% | +1.8 |
| 35–44 | 19.5% | 23.5% | +4.0 |
| 45–54 | 17.3% | 24.2% | +6.9 |
| 55–64 | 17.7% | 26.9% | +9.2 |
| 65 and over | 26.0% | 4.0% | −22.0 |
Two things follow, and neither is comfortable for us.
The missing education stratum is not a rounding error. Ten percent of the adult population is absent from a 1,000-person draw. A survey that cannot reach people without a high school diploma cannot report on them, and any subgroup cut that is correlated with education — income, region, occupation, price sensitivity — inherits that hole. The second run in this study, a separate 1,000-person draw for a different question, produced the same result: zero records below high school.
The age hole is larger. Adults 65 and over are 26% of the 25+ population and 4% of the draw. This is a sample that reads as a working-age population regardless of the audience string you submit. The employment field in the same records agrees: 83% of drawn respondents are employed at work, and only 13% are out of the labour force, a category that includes retirees.
What we can and cannot say about the cause. The records' distribution is consistent with a pool filtered on something correlated with age, education, and labour force participation — home internet access is the obvious candidate, and it is a field the platform itself advertises carrying for each respondent. We did not confirm that, and this data cannot distinguish it from other filters. What the data does establish is the shape of the absence, which is enough to tell a buyer what to check.
The holes reproduce across runs, which rules out one explanation. A single unlucky draw could produce a thin stratum. Two independent 1,000-person draws with different audience strings both returning exactly zero respondents in the same stratum is not a sampling accident.
Post-registration follow-up. After seeing these two results we added two runs that asked the platform directly for the groups it was missing — see Can the pool fill the holes if you ask it to? below. They were added after the freeze and are labelled as such in the pre-registration.
The respondents are not the problem: they report their own records
Here is the finding that reframes the academic argument.
Each synthetic respondent carries a full demographic record — 19 fields, from age and state to occupation code, income band, and marital status — drawn from US Census Bureau ACS PUMS microdata. In the education run, we can compare what a respondent answered against what its own record says. Everyone was asked the same five-way education question.
| Comparison | Result |
|---|---|
| Respondents whose answer matched their own record | 891 of 1,000 (89.1%) |
| Answer below the record | 58 (5.8%) |
| Answer above the record | 51 (5.1%) |
| Largest single disagreement | High school record → "Some college or associate degree" (28 respondents) |
| Second largest | High school record → "Less than high school" (23 respondents) |
An answer that contradicts its own record 10.9% of the time is not nothing, and it is worth saying why it happens: the respondents are not "reading" a field, they are producing an answer conditioned on a profile, and that conditioning is lossy. But compare the two error sizes:
- Errors introduced by respondents disagreeing with their own records: contributes about 7 points of drift in the lowest-education category (from 0% in the records to 2.9% in the answers — moving toward the ACS figure of 10.1%, incidentally).
- Errors already present in the pool: 10.1 points, the entire missing stratum.
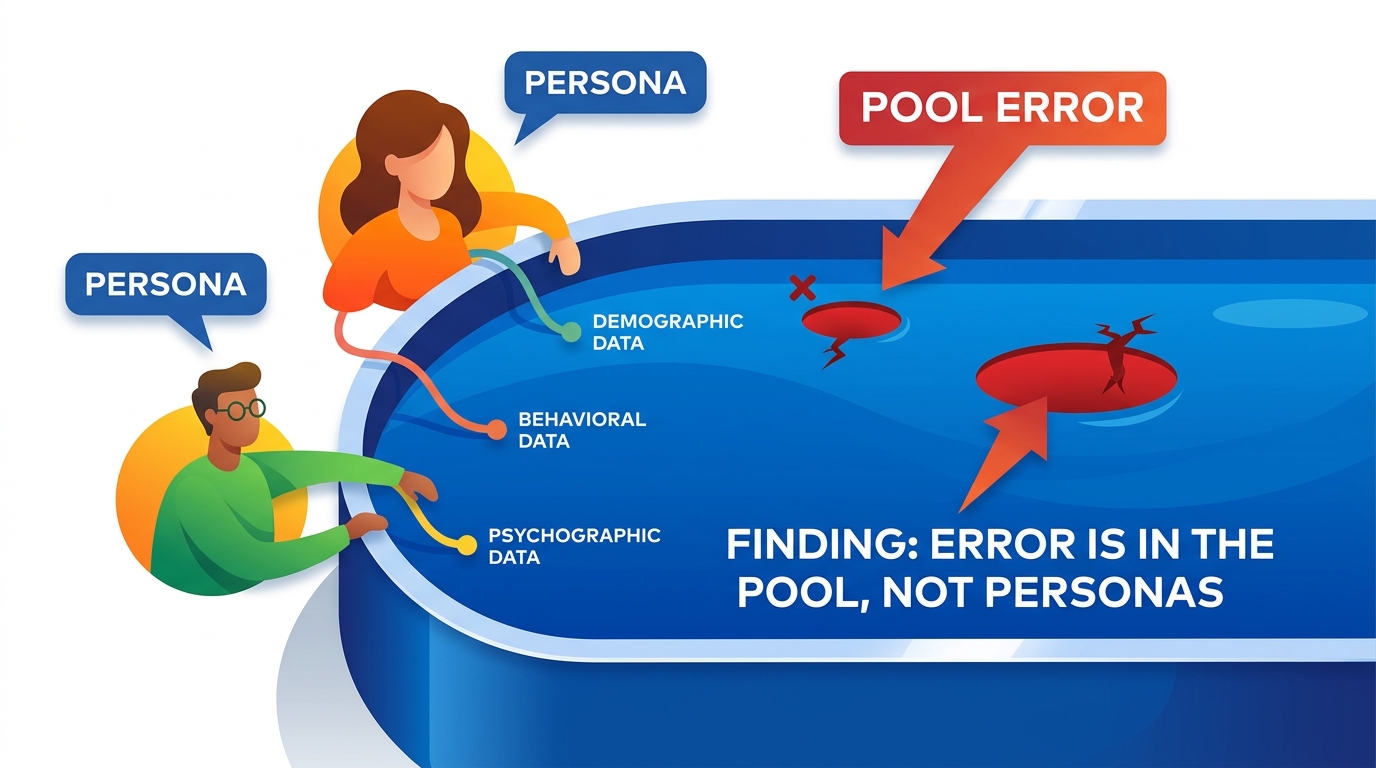
The synthetic respondents were, if anything, compensating for the pool's hole — drawing on the model's prior that some people have less education, and producing 2.9% where the records gave them none. The bias is not a persona problem. It arrives before the persona is built.
That has a practical consequence. If you are auditing a synthetic sample, checking "do the personas behave realistically?" is the wrong test. Check the marginal distribution of the records against a published source first, because that is where the error is large enough to change a decision.

The option set moved our number more than the method did
The GSS trust item has two published versions, and they disagree by more than any synthetic-versus-human gap reported in the literature we know of.
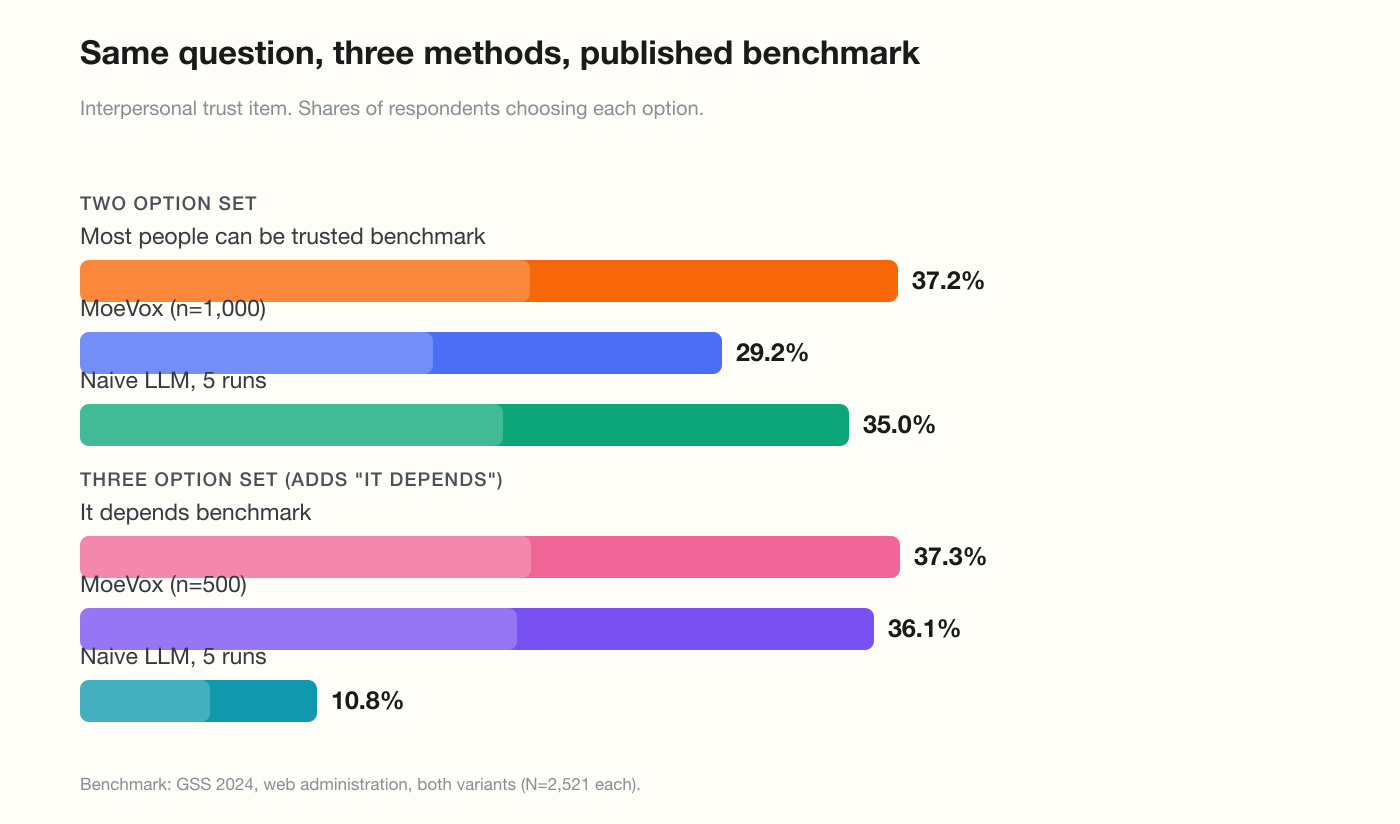
The two-option version reads 37.2% / 62.5%. The version that includes a volunteered "depends" reads 19.4% / 43.3% / 37.3%. Same survey, same year, same item, same N — a 17.8-point difference on the headline number, driven by whether an abstention was on the table.
We ran both versions.
| Version | Option | Published benchmark | MoeVox | Naive LLM (5 runs) |
|---|---|---|---|---|
| Two options | Most people can be trusted | 37.2% | 29.2% (n=1,000) | 35.0% |
| Two options | Can't be too careful | 62.5% | 70.8% | 65.0% |
| Three options | Most people can be trusted | 19.4% | 16.8% (n=500) | 33.2% |
| Three options | Can't be too careful | 43.3% | 47.1% | 56.0% |
| Three options | It depends | 37.3% | 36.1% | 10.8% |
Read the two MoeVox rows together: 29.2% → 16.8%, a 12.4-point move caused by adding one option. That is 70% of the swing the GSS itself reports between its own two versions, in the same direction, from a sample that was otherwise 8 points off the two-option benchmark.
This is the single most useful thing we learned, and it is not about synthetic data at all: the option set you put in front of a respondent, human or synthetic, moves the number more than the population model does. Most "does AI replicate surveys" comparisons do not control for it, which means a good part of the published disagreement between studies may be item format rather than model behaviour.
We also have to report the flaw in our own side of it. The 499 of 500 respondents who completed the three-option run included one sampling failure — the first failure we saw in this batch — and the platform flagged an elevated failure-rate warning alongside it. A single failure in 500 does not change a share by a point. It is reported here because "100% completion" is a claim we made about a different run, and it does not generalise to every run.
Where the naive method wins, and where it collapses
The most uncomfortable table in this study.
A plain general-purpose model, asked "you are simulating 1,000 US adults, give the percentage distribution", produced this:
| Item | Published benchmark | MoeVox deviation | Naive model deviation | Who is closer |
|---|---|---|---|---|
| Education, all five categories | ACS 2024 | up to −7.2 (answer layer) / −10.1 (pool) | up to −1.3 | Naive |
| Trust, two options | GSS | −8.0 / +8.3 | −2.2 / +2.5 | Naive |
| Trust, three options | GSS | −2.6 / +3.8 / −1.2 | +13.8 / +12.7 / −26.5 | MoeVox |
| Smoking | CDC / NHIS | +13.9 ("Yes" 23.8% vs 9.9%) | +1.7 | Naive |
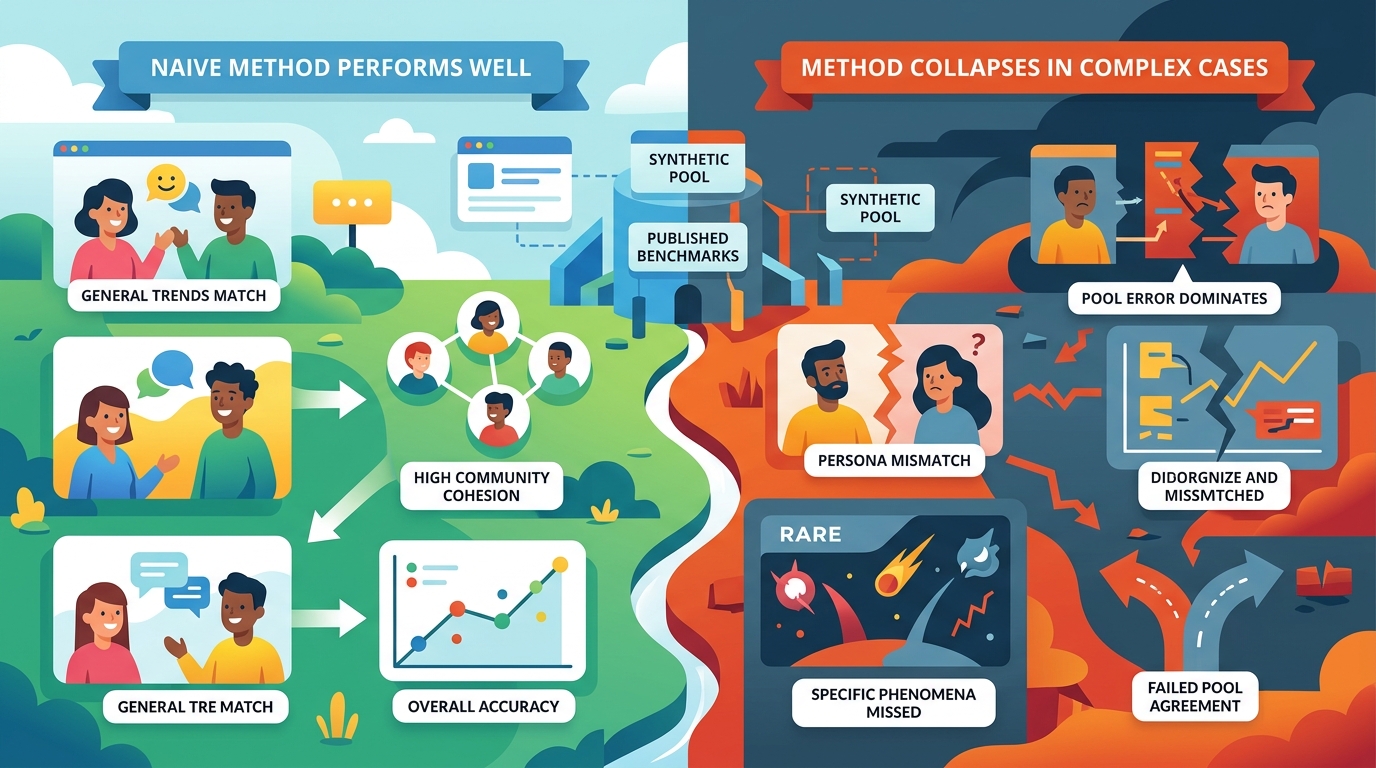
On three of four items, a model answering from memory without any census grounding was closer to the published national figure than a sample drawn from a hundred thousand census records. We predicted instability (at least a 5-point spread across repeats on two items) and that prediction failed: across five repeats the naive model moved by at most 4 points, and usually 0 to 1.
The pattern only makes sense if you ask what each method is actually doing.
The naive model is recalling published marginals, not modelling a population. Education, trust, and smoking prevalence are among the most widely published numbers in American social statistics. A model that has read them can reproduce them, and will do so stably, because it is not estimating anything — it is remembering. This is a strength, and it is also a constraint with a hard edge: it can only be accurate where the answer is already known. Which raises the obvious question of why anyone would commission research into a question whose answer is already published.
The recall breaks exactly where there is nothing to recall. Add an abstention option and the naive model collapses, missing "It depends" by 26.5 points while the census-grounded sample lands within 1.2. The abstention is not a marginal the model has memorised; it requires an actual model of how a population distributes itself across three choices, and recall has nothing to offer. That is the discriminator. If a method cannot represent "It depends", it is not simulating a population — it is reciting a two-way split it has seen before.
And the novel question is the whole use case. Nobody commissions a study to learn the national smoking rate. They commission it to learn which of two taglines wins, whether a price point holds, which segment resists a feature. We asked the naive model one of those — a two-option tagline test with no published answer — and got a stable, confident 54.8 / 45.2. Then we re-ran it with a leading sentence planted in the stem ("Most people prefer the promise of fast delivery over a first-order discount") and got 58.8 / 41.2, a 4-point shift.
That shift is the point. The naive method's answer to an unanswerable question moved 4 points when we changed the framing, by an amount we cannot check because there is no benchmark, in a direction we predicted would favour the fast-delivery option and which it did not. Nothing in that output tells you whether it is off by 3 points or 30. The census-grounded method has its own serious problem — the pool holes above — but at least the problem is inspectable: you can compare its records to the ACS, and we just did.
Both methods are wrong in ways a buyer needs to know. Only one of them is wrong in a way you can look at.
The scorecard: five predictions, two failures
Written before the data, published either way.
| # | Prediction | Outcome |
|---|---|---|
| P1 | Education within 5 points of ACS in every category | Failed. The lowest stratum is off by 7.2 points in the answers and 10.1 in the records. Every other category was within 5.2. |
| P2 | Trust item within 10 points of the GSS topline | Held. Off by 8.0 and 8.3. |
| P3 | Adding "It depends" moves our number ≥10 points, same direction as GSS's 17.8 | Held. Moved 12.4 points, same direction. |
| P4 | Smoking over-reported, because synthetic respondents do not inherit humans' under-reporting | Held, and by more than expected. 23.8% vs 9.9%, a factor of 2.4. |
| P5 | Naive model unstable across repeats (≥5-point spread on 2+ items) | Failed. Maximum spread was 4 points, and it was 0 points on two items. |
Two failures, and the honest reading is that they are the two most informative lines in the table. P1 failing is a real defect in a product we sell, now measured and disclosed. P5 failing dismantles a convenient argument — "the naive way is unstable" — that we would otherwise have used to dismiss the comparison, and it forced the more precise distinction between recall and modelling that this article now rests on.
Can the pool fill the holes if you ask it to?
The observation that 0 of 1,000 records fall below high school invites an obvious test: ask for that group specifically. After the pre-registered batch closed, we added two runs that do exactly that — one requesting 200 respondents aged 65 and over, one requesting 200 respondents aged 25 and over whose own record is below high school. Both are labelled post-freeze in the pre-registration, and neither replaces a prediction above.
Asking for the oldest group works, which relocates the problem. The 65+ request returned a full 200 respondents, every one of them aged 65 or over, drawn from a pool of 3,262 eligible records. That number is the finding. A pool of roughly a hundred thousand records contains about 3,262 people aged 65 and over — around 3% of the pool, against 26.0% of the adult population. The sampler is not failing to find older respondents when asked. It is drawing faithfully from a pool that has already lost them. When the audience string says "adults 25 and over", the draw reflects the pool, and the pool is a working-age population wearing a national label.
Age is not the only field where the 65+ cohort differed. Agreement between answer and record fell to 84% in that run, down from 89.1% in the general sample, and the single most common disagreement was a high-school record producing a "less than high school" answer — ten respondents reaching for a category the pool does not contain.
Asking for the youngest-educated group does not work. This is the strongest evidence in the study, and it is not ambiguous.
| Requested | Returned | |
|---|---|---|
| Audience submitted | US adults aged 25 and over whose highest level of education is less than high school | — |
| Eligible records reported by the platform | 24,843 | — |
| Respondents returned | 200 requested | 200 delivered |
| Education in the returned respondents' own records | below high school | high school, 200 of 200 |
The platform reported 24,843 eligible records and then handed back two hundred respondents whose own census records all read high school. Two explanations fit, and we cannot distinguish them from outside the system: either the pool's education field has no category below high school, so the filter is matching on something looser than it reports, or the filter does not bind on education at all and the candidate count refers to a broader set. Both have the same consequence for a buyer. The stratum is not purchasable. You cannot commission a study of adults without a high school diploma on this platform, and nothing in the response tells you that — the run completed in full, with no warning, no failure, and no shortfall.
And the answers amplified the missing category into a stereotype. These 200 respondents, all of whom hold high school records, were asked whether they currently smoke cigarettes. 74.5% said yes, against 23.8% in the general 500-respondent run on the same question.
Two things can be said about that number without a benchmark. The direction is right: smoking is genuinely more common among adults with less education, and a method that shows no gradient would be worse. The magnitude is not checkable, because the cohort does not exist in the pool — we can compare 74.5% to the national adult figure of 9.9%, and note that it is 7.5 times higher, but that comparison pits a low-education cohort against an all-adult average, and it is the only comparison the data permits.
What that leaves is a more precise version of the persona finding, and a more useful one for anyone auditing these systems. When a respondent is asked to report a field it was built from, it tracks its record (89%). When the audience itself is the stereotype — when the profile is "a low-education person", rather than a person who happens to have a low-education record — the answers amplify instead of tracking. The persona layer is only reliable in the first case. That distinction is invisible unless you publish the records, which is why we published them.
What this means if you are buying a synthetic sample
Five checks, in this order. None of them requires trusting the vendor's summary.
- Ask for the marginal distribution of the records, not the answers. Who did the pool actually contain, by age, education, gender and region? Compare it to ACS for the same population before you look at any result. If the vendor cannot produce this, you cannot evaluate the sample — only the conclusion.
- Check the strata your decision depends on. If your question is about homeowners aged 55+, or about buyers without a degree, the pool's coverage of that group is the only thing that matters. A hole of 22 points in one band makes every subgroup cut that touches it unreliable, and no confidence interval on the report will tell you.
- Treat an abstention option as a diagnostic. Run the item with and without a "depends" or "neither" option. A method that swings wildly between the two versions is modelling the population; one that barely moves may be reciting a split it has seen before.
- Never accept a synthetic number for a behaviour people misreport. Smoking was the cleanest failure in this study — not because the method is uniquely bad, but because real humans already under-report it, and adding a generation step compounds the problem instead of cancelling it. If you need a behavioural rate, use a behavioural source.
- Read the published question, not the summary of it. Our own option sets matched our design and our stems did not match our design. Any study you cite — synthetic or human — should be checked the same way.
The uncomfortable summary is this: for a question with a published answer, you do not need a synthetic sample, and a language model will often beat one. For a question without a published answer, the synthetic sample is the only one of the two whose error you can go and look at. That is a narrower claim than "AI can replace surveys", and it is the one our data supports.
Limitations
Four items is not a validation study. It is a replication of four published benchmarks with 1,000, 1,000, 500 and 500 respondents. It cannot tell you the error rate of synthetic sampling in general, and it should not be read as doing so.
Option sets matched; wording did not. The platform rewrote every question stem, and we published both. Wording effects could account for part of the trust gap, though the direction is not obvious: our fielded stems were broader than the GSS item, and the gap went the same way in both trust versions.
The benchmark numbers are themselves uncertain. The two GSS variants differ by 17.8 points, which is a larger spread than any synthetic-versus-human gap in this study. Any "benchmark" here is a choice among published numbers, and we chose to show both rather than pick the flattering one.
Frame benchmarks use ACS 1-year estimates. Region shares are approximate, aggregated by this study and rounded; we draw no conclusion from differences under two points. The education and age comparisons use published tables (B15003 and B01001) aggregated to match the option categories, and the aggregation rule is stated with the data.
The naive comparison uses one model. A different model, or the same model with a different prompt, would produce different numbers. Its purpose is not to rank models but to separate two failure mechanisms.
All four replication runs and their per-respondent rows are published. Every percentage in this article can be recomputed from them.
Frequently asked questions
Does this mean synthetic survey data is unusable? No, and it does not mean it is equivalent either. It means the failure is concentrated in pool coverage rather than in persona behaviour, so the question to ask is "who is in the pool", not "does the AI answer like a human".
Why did you publish the holes in your own pool? Because the alternative is that someone else finds them after we have made a claim based on the data. The frame holes are real, they are measurable in ten minutes with a public benchmark, and a reader who checks will find them. Publishing them costs us the ability to pretend the sample is representative of everyone. It buys us the ability to say what it is representative of.
Would weighting fix the missing stratum? Weighting cannot create respondents who were never drawn. If the pool contains no records below high school, weighting the ones that exist cannot reconstruct that group — it can only reweight the groups that are present. A fix has to happen at the pool level.
Is the naive model a fair baseline? It is the baseline people actually use. "Ask ChatGPT what people think" is a real method that produces real numbers that get put in real decks. It deserves to be measured with the same seriousness as anything else, and on published marginals it wins more often than we expected.
Which of the two should I use? Neither, for a question whose answer is already published — read the published answer. For a novel question, the decision is about auditability: what can you check afterwards? That is the axis on which the two methods differ most, and it is not the axis either side of the debate usually argues about.
Disclosure
MoeVox is our product. We ran this study on it, we paid for it in credits, and we sell those credits. The naive baseline is a general-purpose model with no connection to the product. We failed to confirm one of our five predictions in a way that reflects badly on the product, and two predictions failed in total; both are reported above with the pre-registration that fixed them in advance. The raw per-respondent rows, the fielded questionnaires and the five-repetition naive outputs are published so that the numbers in this article can be recomputed rather than believed.
Sources
- Argyle, L. P., Busby, E. C., Fulda, N., Gubler, J. R., Rytting, C., & Wingate, D. (2023). Out of One, Many: Using Language Models to Simulate Human Samples. Political Analysis, 31(3), 337–351. doi:10.1017/pan.2023.2
- Bisbee, J., Clinton, J. D., Dorff, C., Kenkel, B., & Larson, J. M. (2024). Synthetic Replacements for Human Survey Data? The Perils of Large Language Models. Political Analysis.
- U.S. Census Bureau, American Community Survey 2024 1-year estimates, table B15003 (educational attainment, population 25 and over) and table B01001 (age and sex).
- General Social Survey 2024, web administration, interpersonal trust item — both the two-option variant and the variant with a volunteered "depends".
- CDC / National Center for Health Statistics, Cigarette and Electronic Cigarette Use Among Adults by Urbanization Level: United States, 2024 — 9.9% of adults used cigarettes in 2024.