
One Question, Eight Runs, Four Different Answers
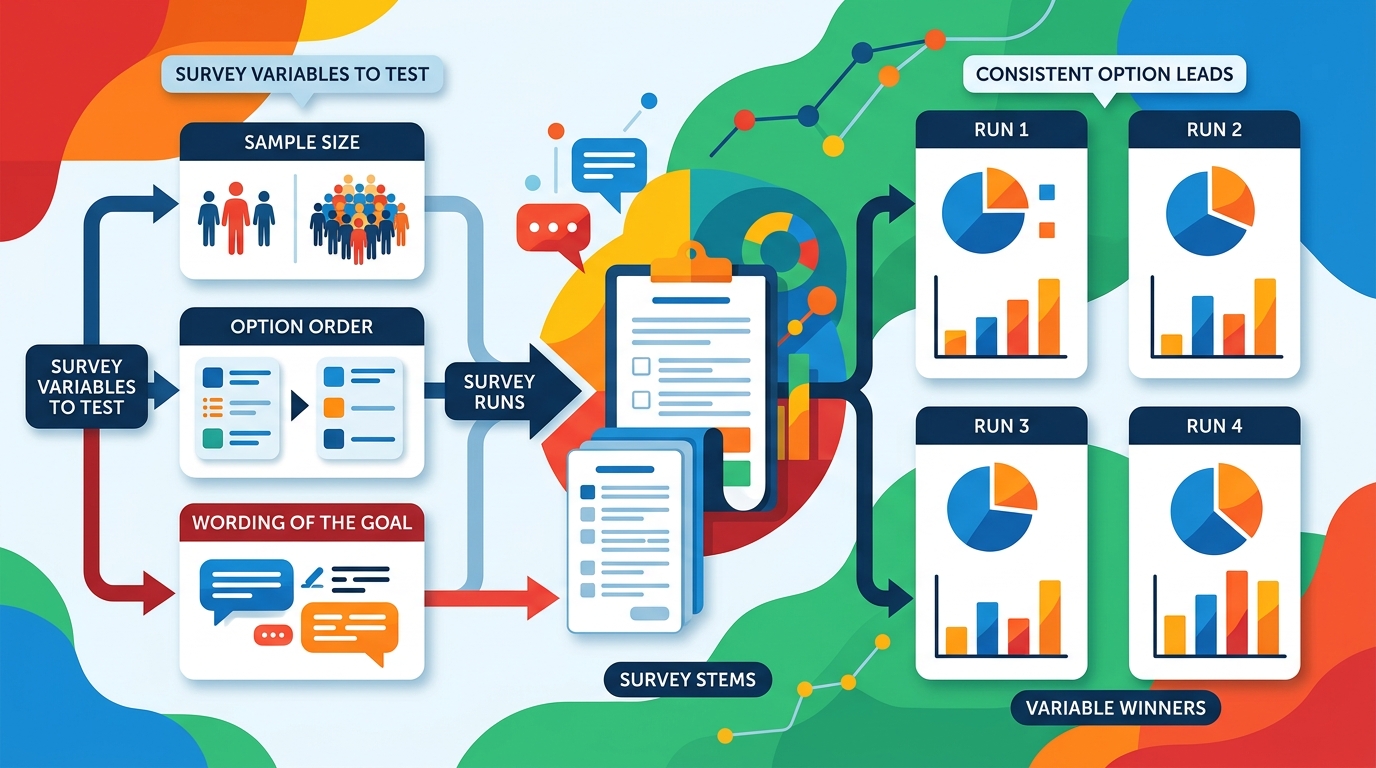
We ran the same two-option question eight times on our own platform, varying one thing at a time. Option order did nothing. Sample size narrowed the interval around a moving target. What actually moved the answer was the sentence the platform writes when it turns your goal into a fielded question.
By Alex Li, Founder · Contact the author
Most advice about survey design tells you to worry about sample size and question order. We ran eight studies on our own platform to check where the movement actually comes from, and the answer was neither.
Same two options every time: a grocery delivery tagline about free first-order delivery against one about 30-minute delivery. Same audience: US adults 18 and over. One variable changed per run — sample size, option order, or the wording of the goal submitted to the platform. Eight runs, 2,450 respondent records, 2,449 usable answers, 2,449 credits.
The option order moved the number by 0.5 points. Multiplying the sample by five made the finding look weaker, not stronger. And the same two options produced leads of +21, +22, +6, and −13.6 points at the same sample size, depending on which run you look at — with one run handing the win to the option that lost by 21 points in another.
The short version
- Option order is not the problem. At n=200, reversing the order moved the leading option's share by 0.5 points (58.5% → 59.0%). This is the design worry that gets the most attention and it is not where the error lives.
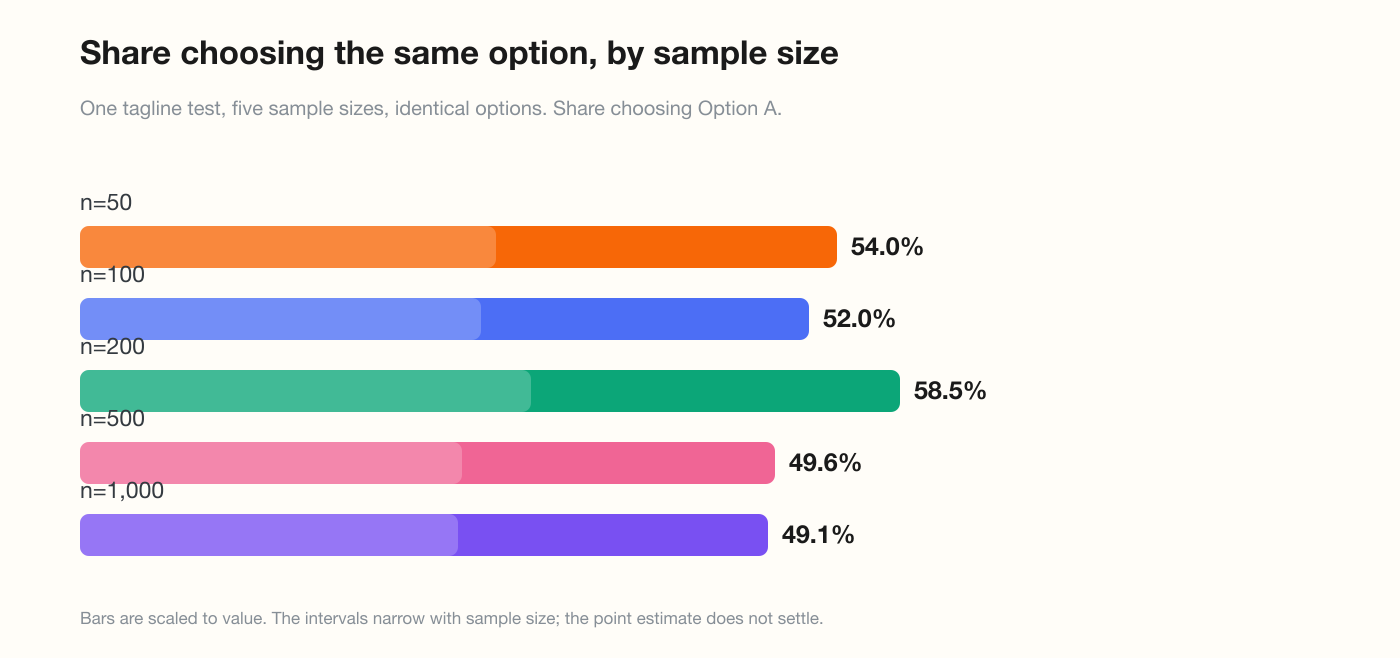
- More sample did not stabilise the point estimate. The leading share ran 54.0% (n=50), 52.0% (n=100), 58.5% (n=200), 49.6% (n=500), 49.1% (n=1,000). The lead shrank from 21 points at n=200 to 3.5 points at n=1,000, and the two confidence intervals do not overlap — so this is not sampling noise.
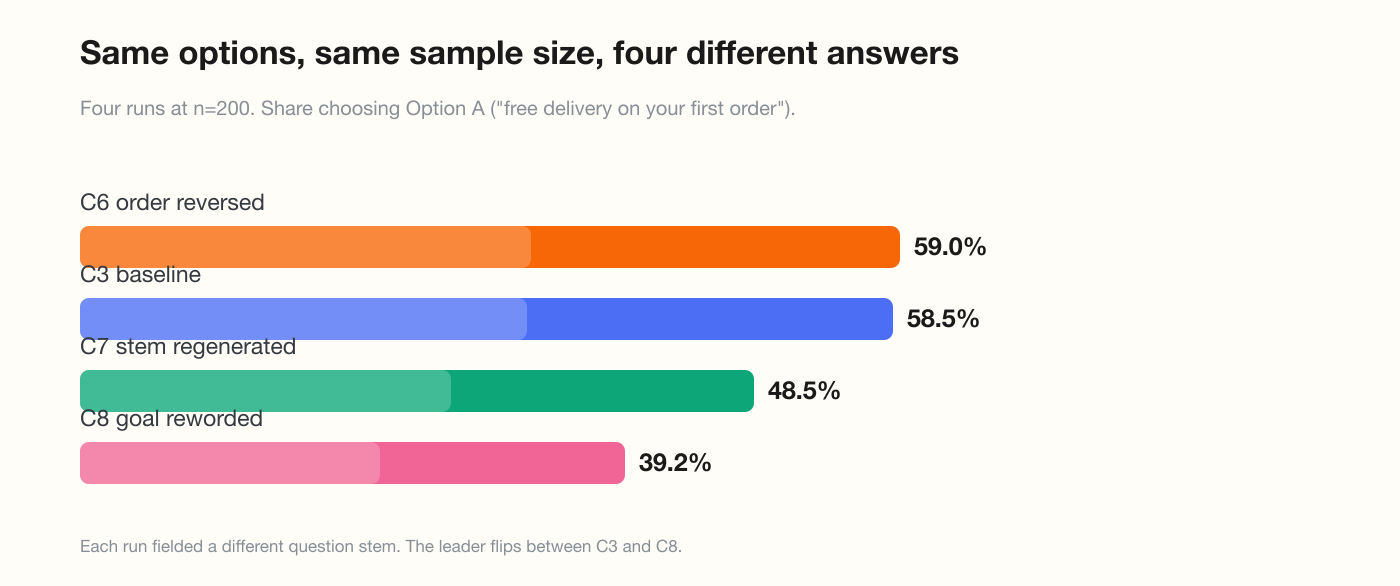
- The largest single source of movement is the sentence the platform writes. Four runs at n=200 with the same options produced leads of +21, +22, +6 and −13.6 points. The instrument that was fielded differed each time, and we publish all four stems.
- The interval printed with a single run does not cover that movement. At n=1,000 the platform can report a ±3-point interval around a number that moved 9.4 points between runs. The interval is arithmetically correct and practically misleading.
- We tried to plant a leading stem and the platform removed it. That is a real safeguard worth crediting, and it also means this test measured something other than what we intended.
- The opt-out share is unstable too. "Neither of these options" ranged from 2.0% to 9.0% across runs on identical options.
What we held fixed, and what we could not
The design was frozen in the pre-registration before any run: one neutral two-option tagline item, fixed audience, a five-point sample-size sweep at 50 / 100 / 200 / 500 / 1,000, one option-order reversal at 200, one leading-stem attempt at 200, one rewording at 200.
One thing we could not hold fixed, and it turned out to be the study. The platform generates its own questionnaire from the goal you submit, and it rewrites the question stem. Submitting the same goal twice does not necessarily produce the same fielded question. So the sample-size sweep is a sweep of sample size and instrument regeneration together, not sample size alone.
That is a genuine limitation of this study, stated up front. It is also the most useful thing we found, because anyone re-running a study on this kind of platform is in the same position: the instrument is not a fixed object between runs unless the platform makes it one.
| Run | Variable | n | Fielded stem |
|---|---|---|---|
| C1 | baseline | 50 | "Which of these taglines makes you more likely to try a new grocery delivery service?" |
| C2 | baseline | 100 | "Which of these grocery delivery service taglines is more appealing to you?" |
| C3 | baseline | 200 | "Which of these grocery delivery service taglines is more likely to make you want to try the service?" |
| C4 | baseline | 500 | "Which of these grocery delivery taglines is more appealing to you?" |
| C5 | baseline | 1,000 | "Which of these grocery delivery taglines is more appealing to you?" |
| C6 | option order reversed | 200 | "Which of these two taglines makes you more likely to try a new grocery delivery service?" |
| C7 | leading stem planted | 200 | "Which of these taglines for a grocery delivery service is more appealing to you?" |
| C8 | goal reworded | 199 | "Which of these taglines would make you more likely to sign up for a new grocery delivery service?" |
Read the stem column top to bottom. Every run was submitted from substantially the same goal, and no two runs fielded the same question.
Sample size: what actually stabilises first
Here is the sweep. Same options, same audience, five sample sizes.
| Sample size | Option A (free delivery) | Option B (30 minutes) | Neither | Lead |
|---|---|---|---|---|
| 50 | 54.0% [40.0, 68.0] | 44.0% [30.0, 58.0] | 2.0% [0.0, 6.0] | +10.0 |
| 100 | 52.0% [42.0, 62.0] | 42.0% [32.0, 52.0] | 6.0% [2.0, 11.0] | +10.0 |
| 200 | 58.5% [51.5, 65.0] | 37.5% [31.0, 44.5] | 4.0% [1.5, 7.0] | +21.0 |
| 500 | 49.6% [45.2, 54.0] | 44.0% [39.6, 48.4] | 6.4% [4.4, 8.6] | +5.6 |
| 1,000 | 49.1% [46.0, 52.1] | 45.6% [42.6, 48.8] | 5.3% [4.0, 6.7] | +3.5 |
Brackets are bootstrap 95% intervals from the per-respondent rows, 10,000 resamples, fixed seed.
Three readings, in increasing order of discomfort.
The direction was stable. Option A led in all five runs. If your question is "which of these two wins", five runs agreed. That is worth something, and it is more than a coin flip.
The magnitude was not. A lead between 3.5 and 21 points is the difference between "we have a winner" and "this is a tie". Purchasing twenty times more sample (50 → 1,000) does not produce a stable lead; it produces a smaller one, and the two most extreme runs are the two largest and one of the smallest.
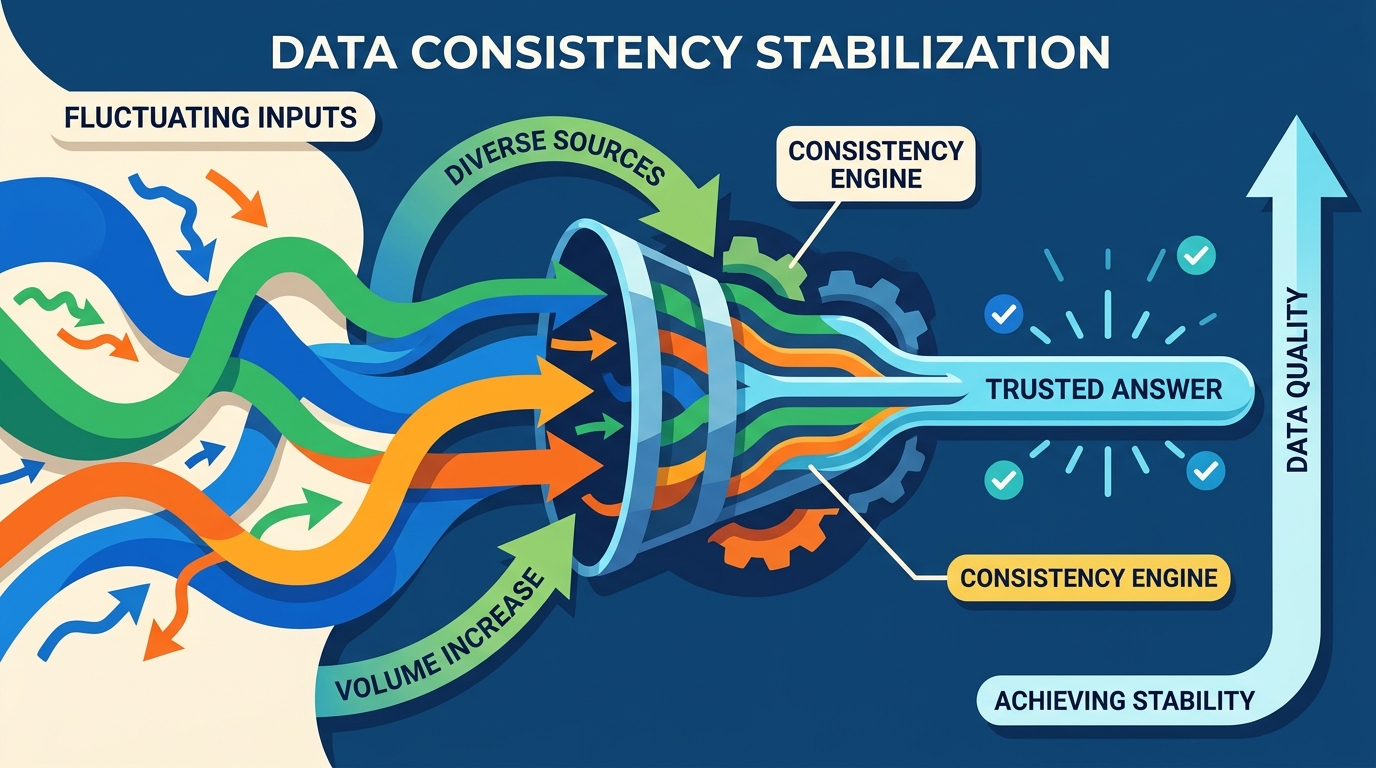
The intervals do not overlap, which is the actual finding. At n=200 the share of Option A was 58.5%, interval [51.5, 65.0]. At n=1,000 it was 49.1%, interval [46.0, 52.1]. A 9.4-point difference in the point estimate, with no overlap between the intervals. Binomial sampling error at those sizes is far too small to produce that. Something other than sample size is moving between runs, and the interval printed with a single run does not include it.
That is a defect worth naming precisely, because it is not unique to synthetic sampling: any pipeline that regenerates its instrument between runs will show a narrower interval than the data supports. The interval answers "how precise is this draw given this question". It does not answer "how precise is this question", and those are different numbers. A 1,000-respondent study reporting ±3 points from a pipeline that moves 9 points between runs is quoting the wrong uncertainty.
Option order: the effect almost nobody controls for
| Run | Option order | n | Option A | Option B | Lead |
|---|---|---|---|---|---|
| C3 | A first | 200 | 58.5% | 37.5% | +21.0 |
| C6 | B first | 200 | 59.0% | 37.0% | +22.0 |
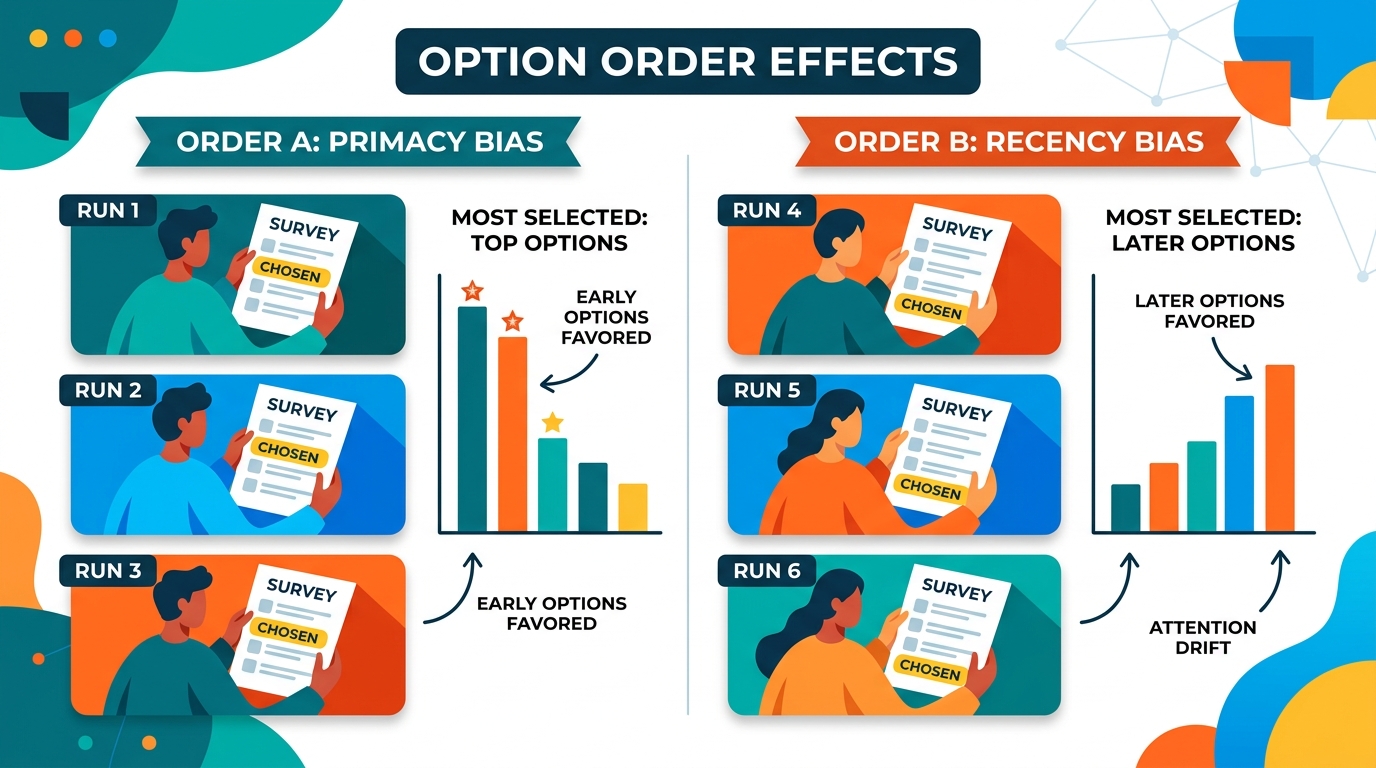
Half a point, on a 21-point lead. The standard advice to rotate option order in a list of choices is good advice, and here it bought essentially nothing — while the two runs fielded different stems, so the 0.5-point agreement across two different instruments is itself a small surprise.
The honest version of this result is narrower than "order never matters". A two-option choice is the easiest case for order effects; a five-option list, a ranking question, or a scale where the endpoints carry meaning are all places where primacy and recency effects have been documented in human samples for decades. What this run supports is a priority claim: if you are choosing which design control to spend effort on, order is not the first one. Wording is.
Wording, and the manipulation the platform rewrites
Two things happened here, and the second one was not in the plan.
We tried to plant a leading stem and it was removed. For C7 we submitted a goal with a leading sentence attached: "Most people prefer the promise of fast delivery over a first-order discount. Which of these two taglines…" The platform rewrote the goal into a neutral fielded stem — "Which of these taglines for a grocery delivery service is more appealing to you?" — with no trace of the planted cue. We cannot attribute that to a deliberate safeguard rather than to the generator's normal rewriting habit, but the effect is real and it is in the platform's favour: a customer cannot accidentally prime their own respondents this way.
Our own phrasing was not rewritten, and it flipped the leader. For C8 we reworded the goal ourselves, from "more likely to try" to "more likely to sign up". The platform fielded that wording almost intact — and the result inverted.
| Run | n | Fielded stem | Option A | Option B | Lead |
|---|---|---|---|---|---|
| C3 | 200 | "…more likely to make you want to try the service?" | 58.5% | 37.5% | A +21.0 |
| C6 | 200 | "…more likely to try a new grocery delivery service?" | 59.0% | 37.0% | A +22.0 |
| C7 | 200 | "…is more appealing to you?" | 48.5% | 42.5% | A +6.0 |
| C8 | 199 | "…more likely to sign up…?" | 39.2% | 52.8% | B +13.6 |
Four runs, same options, same audience, same sample size. C3 and C8 differ by 19.3 points on the same option, and their intervals do not overlap. The leader changes.
We cannot decompose that 19.3 points between two causes, and both are real. The instrument text differs — "want to try" and "sign up" are different intents, and it is defensible that they produce different answers. And the sample differs: each run drew a fresh 200 respondents from the pool. What we can say is that this is the largest movement in the study, and it happens at the layer a customer controls with a single sentence: the goal you type is not a description of your study, it is a draft of the instrument, and the platform may field it almost verbatim.
The practical consequence is unpleasant for anyone treating these numbers as interchangeable. Two studies of "the same question" can differ by nearly twenty points and both be correct outputs of the same system, because "the same question" was never the same question.
The opt-out share moved too, by more than it should. "Neither of these options" came back at 2.0% (n=50), 6.0% (n=100), 4.0% (n=200), 6.4% (n=500), 5.3% (n=1,000), and 9.0% (n=200, C7). At n=1,000, a 5.3% share has a sampling interval of roughly ±1.4 points; the observed range across runs is four times that. Whatever drives the run-to-run movement drives the abstention share as well, and it means the opt-out cannot be treated as a stable constant of the audience.
What to do about it
None of this argues against running the study. It argues for treating a single run's number differently from how these reports usually encourage you to treat it.
- Record the fielded stem, not just your goal. If the platform prints the question it actually asked, save it. If it does not, ask. Two runs are only comparable if the instrument is identical, and in our eight runs it never was.
- Re-run before you act on a small lead. If the decision hinges on a margin under about 10 points, one run has not measured it. Two runs and a look at the spread will tell you more than a narrower interval on a single draw.
- Do not read the printed interval as total uncertainty. It is a binomial interval for one draw. It excludes the component that comes from instrument regeneration, and that component was 9.4 points in this study.
- Be careful with your own verb. "Try", "sign up", "prefer", "recommend" and "buy" are different questions, and the platform may field yours nearly as written. Pick the verb that matches the decision, and check what was fielded.
- Do not spend your design effort on option order. Spend it on the wording of the goal and on re-running. Order cost us half a point; wording cost us nineteen.
- Treat the abstention share as data, not noise. 2% to 9% on identical options is not a stable audience property, and it will not be visible if you only report the winner's share.
Limitations
This is one item, tested eight ways. A neutral two-option tagline is a simple instrument. Order effects, in particular, are expected to be larger on longer lists and on scales, and this study does not speak to those. Nothing here generalises to a five-way ranking.
Sample size and instrument regeneration are confounded in the sweep. We could not hold the instrument fixed while varying n, because the platform regenerates it. The 9.4-point movement between n=200 and n=1,000 is attributable to something other than sampling, but this design cannot separate the stem from the draw.
The C7 manipulation did not survive, so it is not a clean wording test. It is reported as an observation about the platform, not as evidence about leading questions.
Each run drew a fresh sample. That is the correct way to measure run-to-run variation and the wrong way to isolate an instrument effect: with a fixed respondent set, the same eight runs would attribute more of the movement to wording.
Bootstrap intervals describe the draw, not the pipeline. They are computed from the per-respondent rows of a single run, which is exactly why they miss the between-run component this article is about.
All eight runs, their fielded stems and their per-respondent rows are published.
Frequently asked questions
Does this mean I should buy the largest sample? Not by itself. In this study the largest sample produced the smallest, least decisive lead. Buy sample when you need to resolve a small difference that is real; buy repetition first, because repetition tells you whether the difference is stable across runs at all.
Is this a problem specific to synthetic respondents? The between-run movement is. Instrument regeneration is a property of the platform, and any system that writes its own questionnaire between runs will show the same shape. Human panels with a fixed instrument do not have this particular problem, which is one reason their intervals are more trustworthy for a single run.
Why publish this if it argues against trusting a single run? Because a buyer who re-runs will discover it anyway, and the version of this finding that reaches them second-hand is worse. The interval that does not cover the movement is our defect. The user-controlled verb is a defect shared by every platform that generates instruments from a prompt, and it is worth knowing before a pricing decision rides on it.
Can I make the platform reuse an instrument? Not through the interface we tested. The practical workaround is to record the fielded stem and treat runs with different stems as different studies, which is what we now do in our own pipeline.
What should I actually report from a study like this? The fielded question, the sample size, the shares with intervals, and the spread across repeats. A single run's interval without a repeat range is the specific thing this study shows to be insufficient.
Disclosure
MoeVox is our product. All eight runs were commissioned on it and paid for in credits; the eight runs cost 2,449 credits. The naive-model comparisons elsewhere in this series are unrelated to the product. Two of the findings here reflect badly on the platform — an interval that understates run-to-run variance, and a stem that changes between runs on an identical goal — and both are published with the runs that show them.
Sources
- The eight runs, their fielded stems and their per-respondent rows: moevox.com/research-data/design-sensitivity.json
- Pre-registration, including the sample-size sweep and the C6–C8 designs: moevox.com/research-data/preregistration.md
- Companion study on sampling-frame coverage: We Tested a Synthetic Sample Against Four Published Benchmarks
- Companion study on what one citable statistic costs to produce: The Bill of Materials for One Citable Statistic