

The Cost of Eleven Questions, Timed: 73.7 Seconds Versus 25.8 Seconds for 100 Respondents
Same research question, same sample, two questionnaire depths. Cutting the instrument from 11 questions to 3, dropping the open-text question and skipping respondent-profile enrichment removed 219 of the 224 Gemini calls and 48 seconds of wall clock. Here is the per-respondent call chain, the stage-by-stage numbers, and the report sections that disappear with them.
By Alex Li, Founder · Contact the author
Every questionnaire design choice has a bill attached, and the bill rarely appears as a line item. It shows up as latency, as model calls, and as the number of things that can go wrong between a research question and a report. So when a platform offers a "faster" configuration, the useful question is not whether it is faster. It is what exactly got removed, and what that removal takes out of the report.
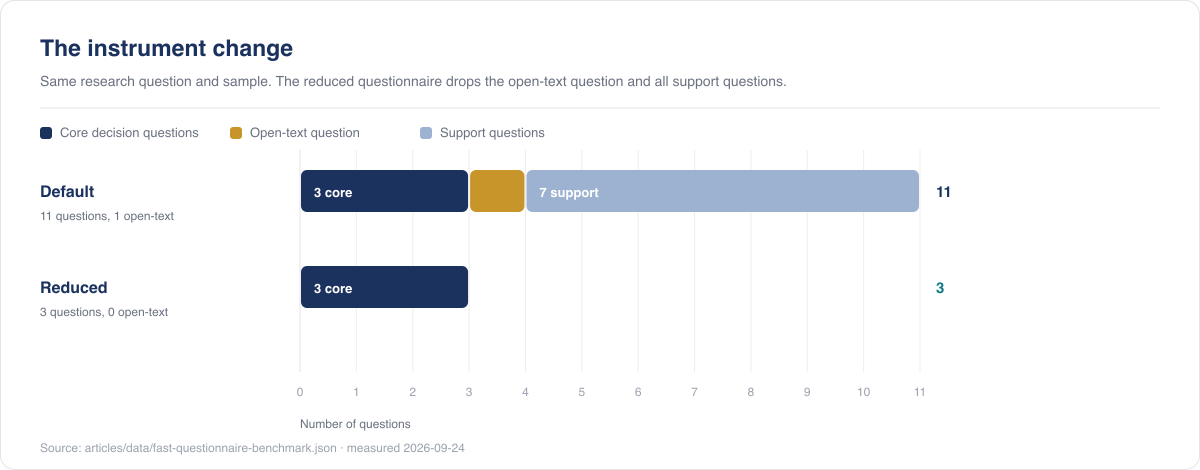
This is a same-question, same-sample comparison of two questionnaire depths, run on our own platform. One configuration is the default instrument: 11 questions covering a winner, a driver, a structured risk, an open-text risk question and seven support questions. The other is the reduced instrument: the same three core questions, no open-text question, no support questions, and no respondent-profile enrichment during sampling.
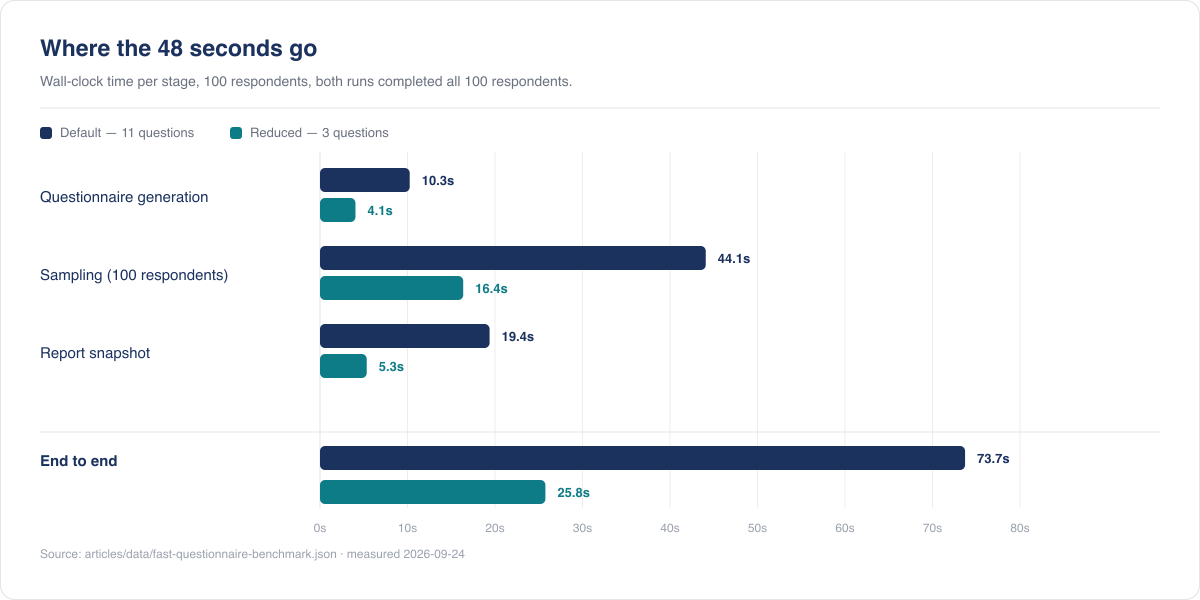
Both runs then sampled 100 respondents against the same audience, answered the questionnaire, and produced a report snapshot. The default configuration took 73.7 seconds end to end. The reduced configuration took 25.8 seconds. It also used 5 Gemini calls where the default used 224.
That is a large difference, and most of it does not come from the questionnaire being shorter. It comes from three specific things, one of which has nothing to do with the questionnaire at all.
The short version
- Both runs answered the same research question, in English, with the same three candidate options, the same audience and the same sampling concurrency of 30.
- The default instrument had 11 questions (3 core, 1 open-text, 7 support). The reduced instrument had 3 questions (3 core).
- End-to-end wall clock: 73.7s → 25.8s. Questionnaire generation 10.3s → 4.1s, sampling 44.1s → 16.4s, report snapshot 19.4s → 5.3s.
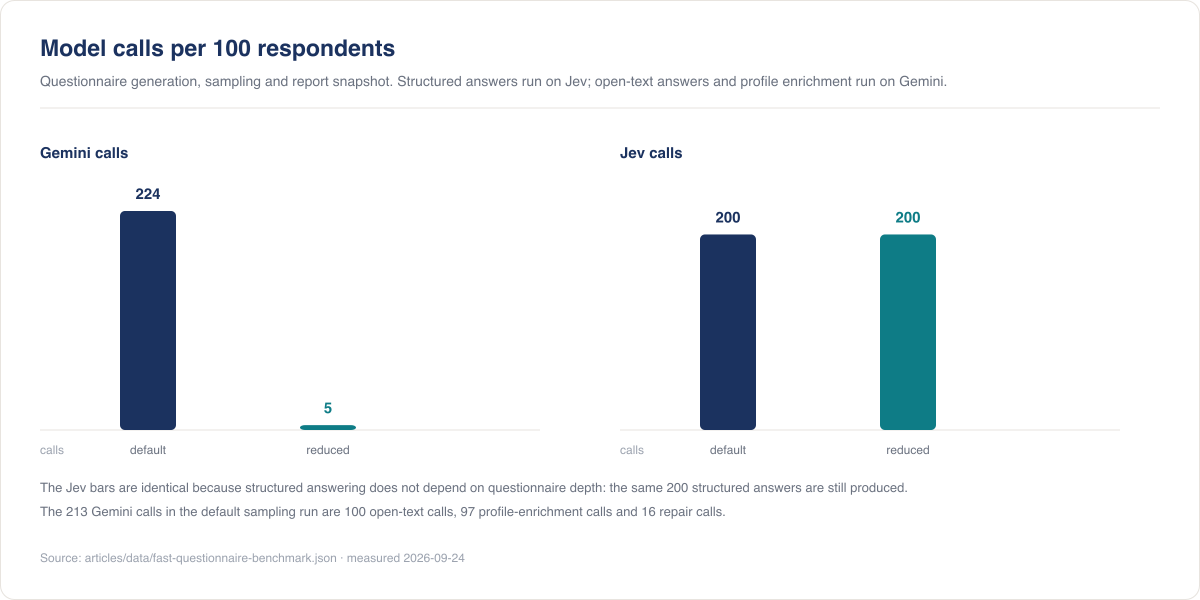
- Model calls: 224 Gemini calls → 5. Structured answering runs on a separate engine (Jev) and did not change: 200 calls in both runs, because question depth does not change how many structured answers 100 respondents give.
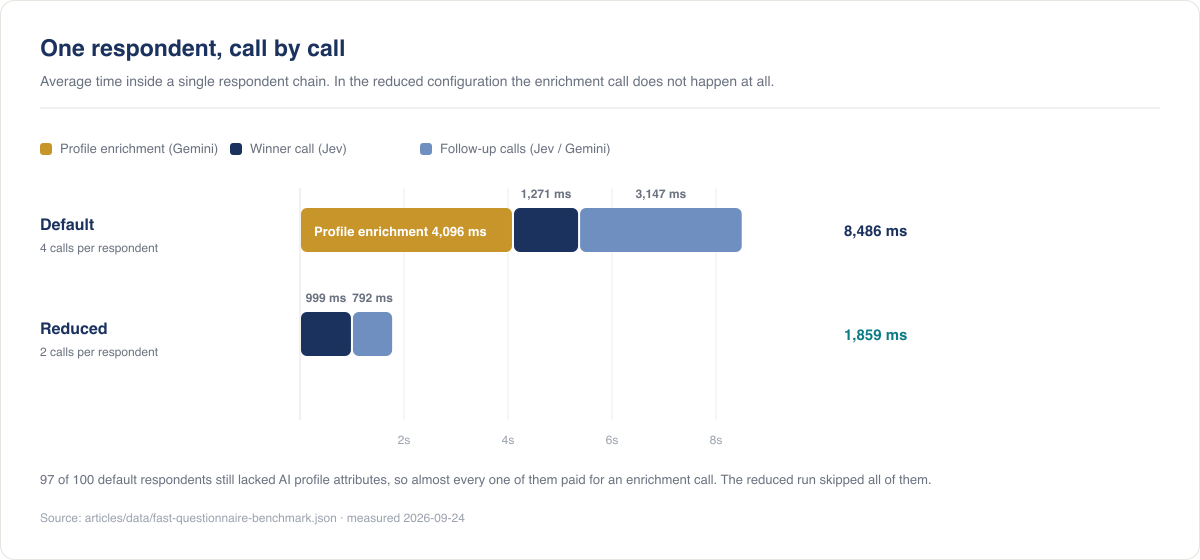
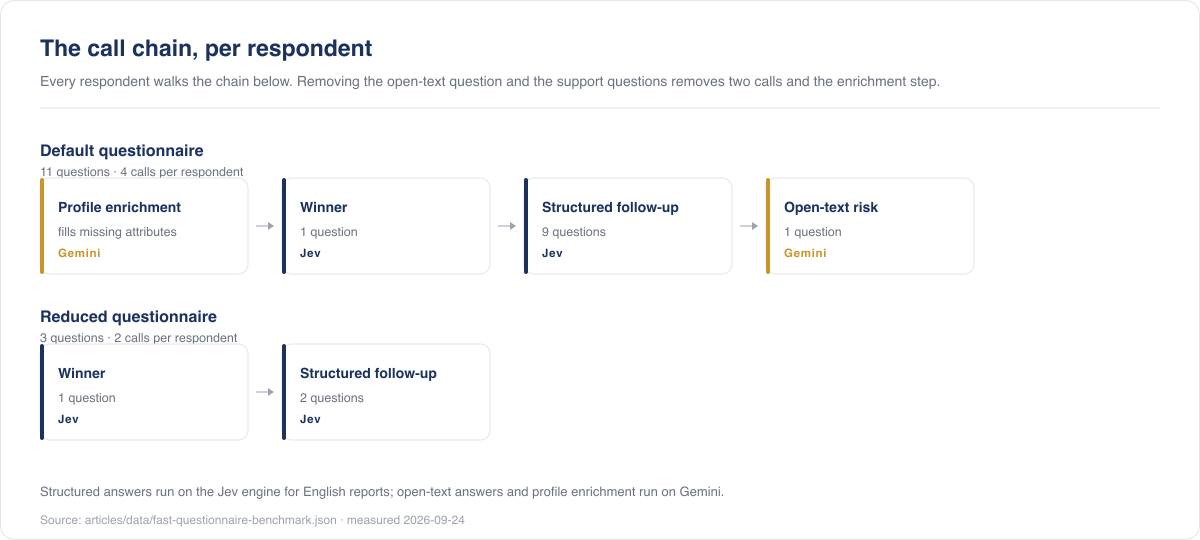
- Per respondent, the default chain averaged 8,486 ms and the reduced chain 1,859 ms — but 4,096 ms of the default chain was a profile-enrichment call that the reduced configuration simply skips. 97 of 100 default respondents still lacked the AI profile attributes that trigger it.
- What the reduced run gives up is report content: 7 support findings, the open-text themes, and the verbatim quotes behind them. If your decision depends on how respondents phrase the risk in their own words, the reduced run cannot answer it.
- The methodological warning is the interesting part: with only 6 respondents per run, the faster configuration measured slower in one of two iterations, because wall clock is bounded by the slowest respondent, not by the average. Per-respondent chain time is the stable statistic; a small wall-clock comparison is not.
What the two runs actually changed
Three things change between the configurations, and only the first two are about the questionnaire.
The open-text question is removed. The default instrument contains one open_text question whose only job is to let a respondent describe the main risk in their own words. It is the question the report's verbatim themes are built from, and it is also the one question that cannot be answered by the structured-answer engine the platform uses for everything else.
The support questions are removed. The default instrument adds support questions on top of the core three — in this run, seven of them: pricing reaction, absolute validation, adoption intent, recommendation support, trust, clarity and fit. They exist to make the recommendation better supported, not to establish the winner. Removing them takes the questionnaire from 11 questions to 3.
Respondent-profile enrichment is skipped. This one is not part of the questionnaire. Before a sampled respondent answers, the platform checks whether their stored profile has the inferred attributes the answering prompts use — traits, persona latents, motivations. If those are missing, it makes an extra model call to fill them in. In the reduced configuration that call is skipped and the respondent answers from whatever the record already contains.
What was held constant
A benchmark of two configurations is only as good as the parts that did not move. Held constant across both runs:
- the research question (which of three pricing plans to launch first) and the three candidate options;
- the report language (English) and therefore the sampling engine routing;
- the audience filters, and the respondent pool behind them;
- the sampling concurrency: 30 respondents in flight;
- the price model: one credit per completed respondent.
What moved is exactly the three changes above. Everything else — intake, scope calibration, questionnaire generation, sampling, report snapshot — ran the same code on the same deployment.
We ran the comparison three times: twice at 6 respondents per configuration to sanity-check the harness, and once at 100 respondents per configuration, which is the run this article reports in detail. The 100-respondent run is the one worth reading; the 6-respondent runs are worth reading second, because they are the reason this article has a section about variance.
The raw measurements, including every stage timing and every per-respondent statistic quoted here, are published as fast-questionnaire-benchmark.json.
The headline run
Both configurations completed all 100 respondents with zero failures, so the comparison is not a completion-rate artefact.
| Stage | Default (11 questions) | Reduced (3 questions) | Change |
|---|---|---|---|
| Questionnaire generation | 10.3s | 4.1s | 2.5× faster |
| Sampling (100 respondents) | 44.1s | 16.4s | 2.7× faster |
| Report snapshot | 19.4s | 5.3s | 3.6× faster |
| End to end | 73.7s | 25.8s | 2.9× faster |
The model-call side is starker than the time side, and it is the part that scales with sample size:
| Model calls, 100 respondents | Default | Reduced |
|---|---|---|
| Gemini (generation, enrichment, open-text, report) | 224 | 5 |
| Jev (structured answers) | 200 | 200 |
| Calls inside one respondent chain | 4 | 2 |
The 213 Gemini calls inside the default sampling run decompose into 100 open-text calls, 97 profile-enrichment calls, and 16 repair or retry calls. The reduced run's single Gemini call is one repaired answer; the other 99 respondents were answered entirely by Jev.
Where the 48 seconds actually went

Three mechanisms account for the difference, and they are not equally important.
The enrichment call is the largest single item
Inside the default run, the average respondent chain was 8,486 ms. Of that, 4,096 ms on average was the profile-enrichment call, and it fired for 97 of the 100 sampled respondents. Its tail is long: the p95 enrichment time was 11.9 seconds and the slowest single enrichment call took 34.1 seconds.
That is a property of the pool, not of the questionnaire. The pool behind this benchmark holds 114,423 respondent profiles, and 111,914 of them (97.8%) still lack the AI attributes that trigger enrichment. A platform whose respondent records are already enriched would see a much smaller gap between the two configurations, because in that case neither configuration pays for enrichment.
It also means the saving is a condition, not a law: the reduced configuration is faster partly because it declines to spend 4 seconds per respondent making the profile richer. Whether that trade is good depends entirely on whether the extra profile detail changes the answers in a way you care about — which this benchmark does not measure.
A shorter questionnaire is mostly a shorter output
The generation stage moved from 10.3s to 4.1s, but the input barely changed: the draft prompt was 12,387 characters in the default run and 11,276 in the reduced run, because scope context and research framing dominate the prompt. What collapsed was the output: 5,460 characters of questionnaire JSON versus 1,946.
That is the general shape of generation cost. Asking for a smaller artefact does not shrink the instructions much; it shrinks what the model has to write. For a 100-respondent study the generation saving is 6 seconds regardless of sample size, which is why the questionnaire side matters less than the sampling side as sample size grows.
Open-text questions also cost on the report side
The report snapshot dropped from 19.4s to 5.3s and from 9 Gemini calls to 3. Some of that is the open-text theme analysis — the default run merges themes across the open-text answers, including a merge round logged as slot_risk_open round 1 batch 1/1. But note what did not go away: the reduced run still spent 5.3 seconds and 3 model calls on the report. Segment and summary work happens regardless of questionnaire depth. Removing the open-text question removes the theme analysis, not the analysis.
What the reduced run gives up
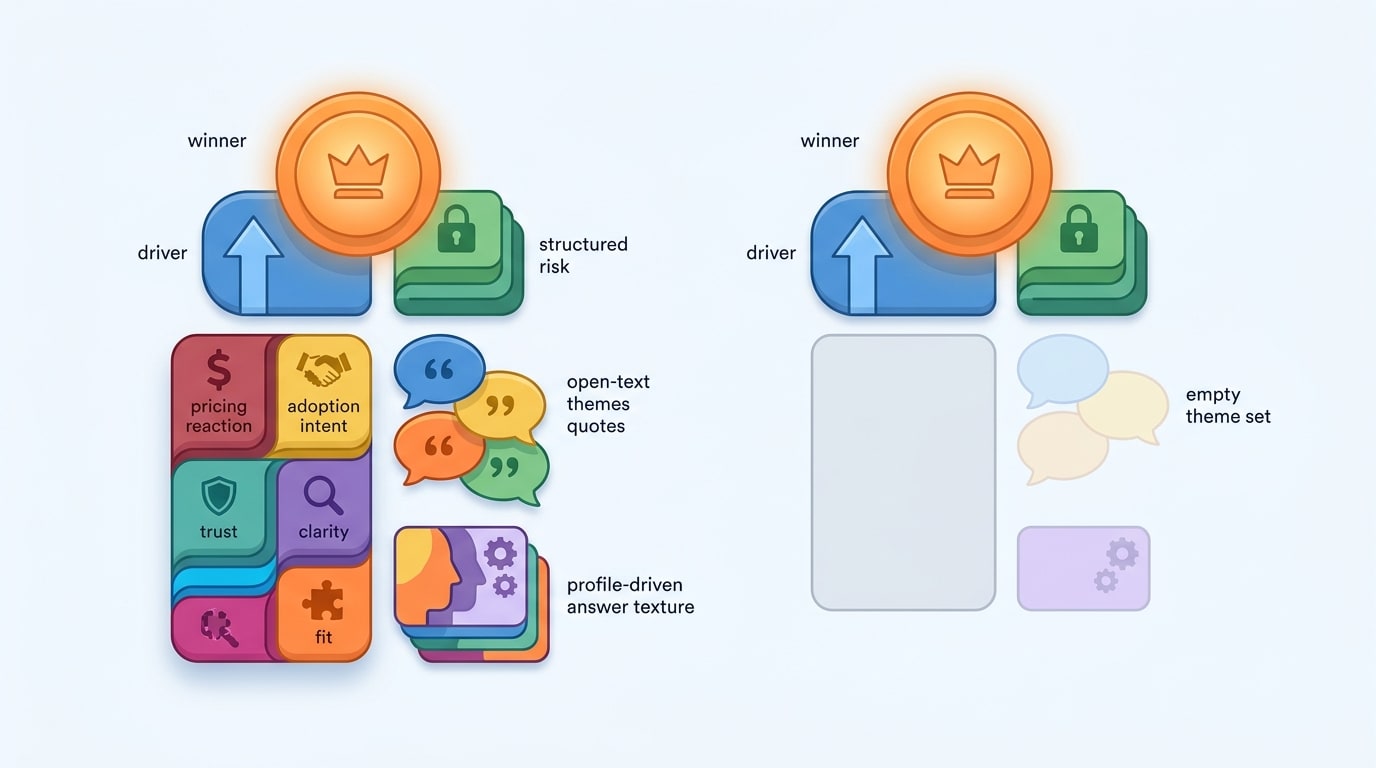
The saving is real and the cost is also real, and it is a content cost rather than a speed cost.
Seven support findings. The default report contains a findings block for each support question: pricing reaction, adoption intent, trust, clarity, fit, and so on. The reduced report has none of them, because the questions were never asked. The winner, the driver, the structured risk, the confidence level and the segment breakdown are still there.
The open-text themes, and the quotes behind them. The default configuration produces theme counts over verbatim risk answers. The reduced configuration produces an empty theme set, because there is nothing to summarise. This is the difference that matters most in practice: a structured risk question tells you which risk option respondents picked, and an open-text question tells you how they describe it. Reports that quote respondents cannot be produced from the reduced instrument.
Profile-driven answer texture. Answers in the reduced run are generated from whatever profile data the record already has. We did not measure how much answer quality drops when enrichment is skipped; the benchmark measures time and call volume, and it deliberately does not claim anything about accuracy. Anyone using that configuration should treat answer richness as unverified rather than as equal.
One thing the reduced run does not give up: coverage. All 100 respondents completed, in both configurations. The reduced configuration is a smaller instrument, not a smaller study.
The trap: at six respondents, the faster configuration looked slower
The first two iterations used 6 respondents per configuration. They disagreed with each other, and with the 100-respondent run:
| Iteration | Respondents | Default sampling | Reduced sampling |
|---|---|---|---|
| 1 | 6 | 22.3s | 4.1s |
| 2 | 6 | 10.3s | 33.7s |
| 3 | 100 | 44.1s | 16.4s |
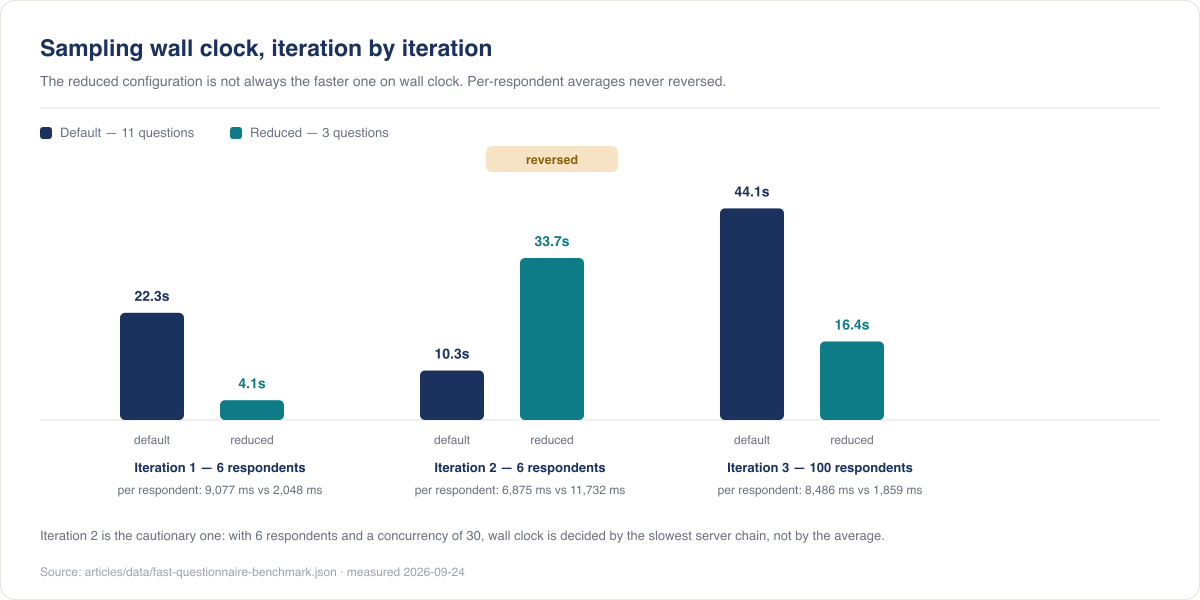
Iteration 1 agreed with the headline result. Iteration 2 reversed it: the reduced configuration took 33.7 seconds while the default took 10.3 seconds, and its per-respondent average chain was 11,732 ms against the default's 6,875 ms — despite doing strictly less work per respondent.
The explanation is the concurrency setting. With 30 respondents in flight and only 6 to process, all 6 run in parallel. Wall clock is then bounded by the slowest single respondent, not by the average, and the slowest respondent is dominated by whatever the upstream engine was doing at that moment. In iteration 2 one respondent's structured call came back slowly; the whole run waited for it. The per-respondent averages in the same iteration still show the reduced chain doing less, if less dramatically.
This is not a flaw in the benchmark, it is a property of every wall-clock comparison on a concurrent pipeline. It is also why the raw data file publishes per-respondent statistics alongside the stage timings: avg_ms, p95_ms and max_ms for the chain, plus the enrichment split. If you re-run this benchmark yourself, compare those fields first and treat the wall clock as a summary that needs a large enough sample to be stable — in this case, 100 respondents, not 6.
When the reduced questionnaire is the right instrument
The measured difference is roughly a factor of three in time and a factor of 45 in Gemini call volume for this study shape. That is worth having when the questionnaire depth is not what you are buying:
- Iterating on a question. When you are testing whether a question is legible and whether respondents will engage with it, the support questions and the open-text probe add cost without adding information you are looking at.
- Directional reads at scale. If the decision is "which of these three wins, and is the margin big enough to keep going", the three core questions answer it.
- Large parallel batches. Call volume scales with sample size, and 219 removed calls per 100 respondents becomes 2,190 removed calls per 1,000. This is where the reduced configuration is not a convenience but a budget line.
And when it is the wrong instrument:
- When you will publish the report. A published report with no verbatim respondent language and no support findings is a weaker artefact, and readers notice the absence even when they cannot name it.
- When the risk language is the finding. Some studies only matter because of how respondents describe the blocker. That question is an open-text question by definition.
- When the recommendation has to survive scrutiny. Support questions are what let a recommendation cite corroborating signal rather than a single winner question. Removing them removes the corroboration.
The default 11-question instrument exists because those are the things most studies end up needing. The reduced instrument exists because a useful share of them do not, and paying 48 seconds and 219 model calls per 100 respondents to find that out is the expensive way to learn it.
What this benchmark does not tell you
- It is our own platform, and we are not a neutral party. Both configurations are ours, the numbers come from our own instrumentation, and the full per-iteration output is published above so the arithmetic can be checked rather than trusted.
- It does not measure answer quality. Nothing here says enriched profiles produce better answers, only that enrichment costs about 4 seconds per respondent when the profile lacks attributes.
- It is one question in one language on one deployment. The 2.9× end-to-end ratio is a measurement of this study shape, not a promise about yours. Latency from the answering engines moves between runs; the structural savings (fewer questions, no enrichment call, no theme analysis) do not.
- It does not separate provider variance from configuration effects. The runs were made against live engines, so some of the spread is upstream load. That is the point of publishing per-respondent distributions rather than a single number.
- It does not price anything in currency. Credits are the platform's internal unit; the runs consumed 100 credits per configuration at 100 respondents, and 224 credits across the whole benchmark.
Reproduce it
The measurements are published as a single JSON file with the design, the instrument definitions, the call chains and the per-iteration results:
- fast-questionnaire-benchmark.json —
design(what was held constant),instrument(both questionnaires),model_calls_per_respondent,results.iteration_1..3, andnotesfor the caveats above.
The figures in this article are generated from that file by scripts/research-articles/fast-questionnaire-benchmark-figures.mjs, so the bar lengths and the numbers in the tables cannot drift apart from the measurements. The illustrations are generated by scripts/research-articles/g-cost-of-eleven-questions-images.mjs, which feeds the real article text to the image model rather than a hand-written concept. Both scripts upload their output to the same image host the rest of this series uses and record the URL, the method and the prompt in articles/research-images-g-cost-of-eleven-questions.json; the image URLs in this page come from that record, so re-running a figure rewrites the link rather than leaving a stale one behind. The reduced configuration is a single request parameter on the platform, so the comparison is reproducible by submitting the same question twice with only that parameter changed; the timings above come from a local development deployment of the same pipeline. If you want the sample-size context behind the 100-respondent choice, see How Many Survey Respondents Do You Need?; for what a study of this shape costs in money rather than seconds, see What a Survey Actually Costs in 2026.
Appendix: all three iterations
| Iteration (respondents) | Configuration | Questions | Generation | Sampling | Report | End to end |
|---|---|---|---|---|---|---|
| 1 (6) | Default | 11 | 15.1s | 22.3s | not measured | — |
| 1 (6) | Reduced | 3 | 3.0s | 4.1s | not measured | — |
| 2 (6) | Default | 11 | 6.1s | 10.3s | 13.0s | 29.3s |
| 2 (6) | Reduced | 3 | 4.1s | 33.7s | 7.1s | 45.0s |
| 3 (100) | Default | 11 | 10.3s | 44.1s | 19.4s | 73.7s |
| 3 (100) | Reduced | 3 | 4.1s | 16.4s | 5.3s | 25.8s |
The first iteration did not record the report-snapshot stage, which is why its end-to-end column is empty rather than zero. Every other number in this table comes from the same JSON file linked above.